Operations | Monitoring | ITSM | DevOps | Cloud

February 2024

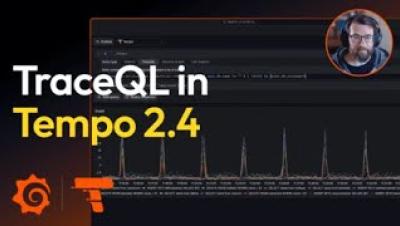
Grafana Tempo 2.4 release: TraceQL metrics, tiered caching, and TCO improvements

Grafana Tempo 2.4 is here and comes with a stack of new features and enhancements to help improve performance and operational capabilities. Check out the video above, which highlights the new experimental TraceQL metrics feature that creates metrics from traces, and continue reading to get a quick overview of all the latest updates in Tempo. If you’re looking for something more in-depth, don’t hesitate to jump into the Grafana Tempo 2.4 release notes or the changelog.

How to Manage Kubernetes Resources and Costs with Grafana Cloud

To help optimize your Kubernetes resources (and the costs associated with them), Kubernetes Monitoring in Grafana Cloud offers features to manage and monitor Kubernetes resources and, in return, your observability bills. In this video, we'll show you how Kubernetes Monitoring helps you: ☁️ Grafana Cloud is the easiest way to get started with metrics, logs, traces, dashboards, and more. We have a generous forever-free tier and plans for every use case.

New TraceQL metrics feature in Grafana Tempo 2.4

In this video, you'll see a deep dive demo into the experimental TraceQL metrics feature in Grafana Tempo 2.4. We'll show you how to use TraceQL metrics to do both root cause and impact analysis as well as other use cases, such as determining how many database queries are downstream of your application. ☁️ Grafana Cloud is the easiest way to get started with metrics, logs, traces, dashboards, and more. We have a generous forever-free tier and plans for every use case.

Getting started with Pyroscope: Intro to continuous profiling

Grafana Pyroscope is a multi-tenant continuous profiling aggregation system, aligning its architectural design with Grafana Mimir, Grafana Loki, and Grafana Tempo. It facilitates the ingestion, storage, and querying of profiles and seamlessly integrates with Grafana, enabling a cohesive correlation of profiling data with existing metrics, logs, and traces.

Kubernetes Monitoring: How to Get Started in Grafana Cloud | Grafana

Start monitoring your Kubernetes cluster in less than 3 minutes! This is a quick but comprehensive guide for getting started with Kubernetes Monitoring in Grafana Cloud. Ideal for both beginner and experienced users, you'll see a step-by-step approach for installing the Helm chart on your Kubernetes cluster so you can validate the health and integrity of your infrastructure. Helpful links: ☁️ Grafana Cloud is the easiest way to get started with metrics, logs, traces, dashboards, and more. We have a generous forever-free tier and plans for every use case.

How to Detect Infrastructure Anomalies with Kubernetes Monitoring in Grafana Cloud | Grafana

This video provides a comprehensive guide to initiating Kubernetes monitoring within Grafana Cloud, detailing a straightforward, step-by-step approach for installing the Helm chart on your cluster. It further ensures that you can validate the health and integrity of the data underpinning the solution, setting a solid foundation for effective monitoring practices. Ideal for both beginners and experienced users, this tutorial is designed to streamline your monitoring setup process with precision and ease.

Grafana Cloud updates: AI for incident response, Enterprise plugins, Kubernetes alerting, and more

At Grafana Labs, we’re constantly shipping new features to help our users get the most out of Grafana Cloud. In case you missed it, here’s a roundup of all the Grafana Cloud news, updates, and improvements you should know about.

How to monitor a home VPN from anywhere with Grafana Cloud

I’m a senior solutions engineer here at Grafana Labs, but I recently found myself trying to solve a real-world problem in my homelab. The issue was, I have some services running there and I want to be able to access my home network when I’m away. Of course, I had to make sure my network remains safe when I do that, so I decided to deploy a simple and secure VPN.

Easily monitor your Rocky Linux server using the Linux integration for Grafana Cloud

Rocky Linux is a community-driven, open source operating system that is backed by CIQ, the primary sponsor and support provider. This OS is a powerful alternative for those seeking a downstream, binary-compatible option to Red Hat Enterprise Linux (RHEL). CIQ supports Rocky Linux as a response to changes in the CentOS project, which is no longer maintained as a stable downstream clone of RHEL.

AI-powered diagnostics for incident response: New Sift features in Grafana IRM

Sift is a machine-learning-powered diagnostic feature in Grafana Cloud that SREs and DevOps teams can use to automate routine parts of incident investigation, such as searching for new errors in logs, surfacing recent deployments, or identifying overloaded Kubernetes nodes. We want Sift to springboard you into an investigation, so useful context is already there by the time you see an alert or declare an incident.

How the open source Caddy server uses Grafana Cloud for full-stack observability

Mohammed Al Sahaf serves as Technical Product Manager at Samsung Electronics Saudi Arabia. Outside his day job, he serves with the Caddy team to tackle the web of problems facing web servers in the third millennium. Mohammed is the author of Kadeessh, formerly caddy-ssh, and the maintainer of numerous Caddy modules. When he isn’t programming, he is trying to catch up on life and sleep with the help of coffee.

How to instrument your Python application using OpenTelemetry

If you want to see if OpenTelemetry helps you become a better Python developer — or if you just want to know how to add OpenTelemetry to your Python service — you’ve come to the right place. In this blog, we’ll show you how to instrument your Python application using OpenTelemetry and how to visualize your OpenTelemetry data using Application Observability in Grafana Cloud. We’ll walk you through the following steps.

OpenTelemetry: 3 questions to ask before choosing an observability solution

As OpenTelemetry rises in popularity, more organizations are implementing, or planning to implement, the open source project to monitor their applications — and, meanwhile, more vendors are offering OpenTelemetry support. In fact, a quick Google search for “OpenTelemetry support” shows results ranging from legacy APM vendors to newer, cloud native solutions like Grafana Cloud.

How to start with Kubernetes monitoring in Grafana Cloud

This video provides a comprehensive guide to initiating Kubernetes monitoring within Grafana Cloud, detailing a straightforward, step-by-step approach for installing the Helm chart on your cluster. It further ensures that you can validate the health and integrity of the data underpinning the solution, setting a solid foundation for effective monitoring practices. Ideal for both beginners and experienced users, this tutorial is designed to streamline your monitoring setup process with precision and ease.

Kubernetes alerting: Simplify anomaly detection in Kubernetes clusters with Grafana Cloud

Despite the widespread adoption of Kubernetes, many DevOps teams and SREs still struggle to troubleshoot issues because of all the complexity that comes with the open source container orchestration platform. That’s why we developed Kubernetes Monitoring, an application in Grafana Cloud you can use to visualize and alert on your Kubernetes clusters.

'The Story of Grafana' documentary: From one developer's dream to 20 million users worldwide

On Dec. 5, 2013, Torkel Ödegaard made the first commit in GitHub for a personal project that would become Grafana. “It’s hard to believe it’s been 10 years since Torkel launched Grafana, growing from a small man with a big dream to becoming the most popular data visualization software in the world,” says Grafana Labs co-founder and CEO Raj Dutt. “The Story of Grafana” chronicles that meteoric journey.

Introducing Grafana 10.3

Grafana 10.3 is here! From improving your ability to create and navigate complex canvas panels to monitoring via anonymous access control, this release is all about enhancing efficiency and clarity in your observability journey. In this video, learn more about: Canvas Pan and Zoom Improved Tooltips Metric Analysis Alerting enhancements Multi-stack data sources Anonymous access control Stay with us through this playlist to delve deeper into each addition and maximize your Grafana 10.3 experience.

Exploring logs, metrics, and traces with Grafana - Grafana for Beginners Ep. 7

Exploring logs, metrics and traces for the first time could be an overwhelming experience if you don't know where to start. Join Senior Developer Advocate, Lisa Jung to get the 101 on using the Grafana explore tool and start exploring your data! Best practices.

New in Grafana k6: The latest OSS features in v0.49.0 and static IPs in Grafana Cloud k6

Grafana k6 v0.49.0 has been released, featuring a built-in web dashboard for real-time result visualization and tons of other improvements for Grafana k6 OSS. Here’s a quick overview of the latest features in Grafana k6 v0.49.0, as well as some other exciting updates related to Grafana Cloud k6 and the k6 ecosystem. To learn more about k6 and performance testing, check out the Grafana Labs blog.

The Story of Grafana | Episode 4: Evolution | Grafana Documentary

From an open source project to an open observability platform, Grafana's evolution continues to drive massive adoption and impactful use cases worldwide. The story of Grafana has only just begun. As we wrap up the Grafana 10th anniversary documentary with this final episode, we'd like to give special thanks to the Grafana community and extended open source ecosystem for all of the contributions and support this past decade. There's so much more to look forward to and we can't wait for what's next!

The Story of Grafana documentary: From dashboards to full-stack observability and beyond

Beehives in backyards. Rocket launches in California. Sourdough starters in mason jars. Shipping containers growing strawberries in Paris. “The stories you can tell from just a graph were really surprising,” says Grafana creator Torkel Ödegaard. But not impossible with Grafana, the ubiquitous open source visualization tool that is not just for monitoring applications.

Combining tracing and profiling for enhanced observability: Introducing Span Profiles

In today’s complex data landscape, continuous profiling has become essential for detailed insights into application resource usage. Grafana Labs is now advancing this field with the introduction of Span Profiles in Grafana 10.3. The Span Profiles feature represents a major shift in profiling methodology, enabling deeper analysis of both tracing and profiling data. Traditional continuous profiling provides a system-wide view over fixed intervals.

Infinity plugin for Grafana: Grafana Labs will now maintain the versatile data source plugin

Grafana was initially renowned for its ability to help users visualize time series data for platforms like Graphite and Elasticsearch. However, as the landscape evolved, demand surged for Grafana to embrace a wider array of data formats, particularly from third-party APIs.

Visualize Sumo Logic metrics and logs with Grafana: Introducing the Sumo Logic Enterprise plugin

We are thrilled to announce the addition of a powerful new Enterprise plugin in the Grafana ecosystem: the Sumo Logic Enterprise data source plugin for Grafana. You can now easily connect Sumo Logic to your Grafana instance and correlate your log data with telemetry from all your data sources in one unified Grafana dashboard.