Dashboards

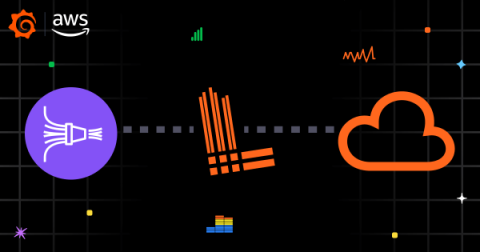
Logs with Firehose: Stream logs to the AWS Observability app cheaper and easier

AWS is an essential part of many organizations’ tech stacks today, which is why we continue to make it easier to observe your environment in Grafana Cloud. We recently launched AWS Observability, a fully managed application for visualizing and alerting on dozens of AWS offerings. And with our latest update, we’re making it cheaper and simpler to ingest and query your AWS logs.

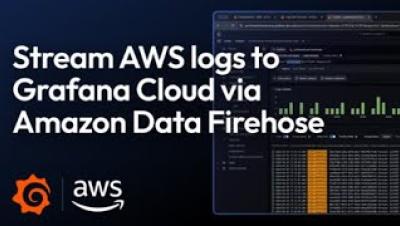
How to Stream AWS Logs to Grafana Cloud via Amazon Data Firehose | Grafana

In this video, we show you the steps to configure your Grafana account so you can start streaming AWS logs to Grafana Cloud using Amazon Data Firehose. It takes just a few minutes to set up so you can see your logs in Grafana Explore. Save money and time by using this new approach!

Data source security in Grafana: Best practices and what to avoid

Recently, an incorrect security report was published, claiming that there’s a SQL injection attack in Grafana. As we have communicated to the security researcher, this report is wrong. Authenticated users in Grafana have the same permissions as the user configured for the underlying data source.

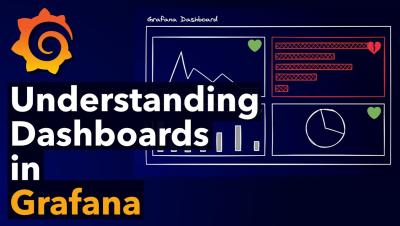
Understanding Dashboards in Grafana | Panels, Visualizations, Queries, and Transformations

Gain a fundamental understanding of what Dashboards are in Grafana and how they can be used to visualise your data to ensure your systems remain healthy and operational. We'll cover the must know concepts, including panels, visualizations, queries, and transformations, that will ensure you have all the tools you need to build awesome dashboards in Grafana. Chapters: ☁️ Grafana Cloud is the easiest way to get started with Grafana dashboards, metrics, logs, and traces. Our forever-free tier includes access to 10k metrics, 50GB logs, 50GB traces and more. We also have plans for every use case.

Setting up your Grafana k6 performance testing suite: JavaScript tools, shared libraries, and more

Editor’s note: This blog post is the second in a series of posts about organizing your performance testing suite with Grafana k6. If you haven’t already, be sure to check out the first post in the series, which explores how to implement reusable test patterns and other best practices within your testing suite.

The Best 15 Interactive Dashboard Examples

Your organization, irrespective of its size, is likely creating a substantial amount of data, and deriving value and insights from this data is vital. This is where dashboards can assist you. With reporting dashboards, you can cut through the noise, and select the metrics that are pivotal to your team to begin visualizing them and the trend of these metrics through continuous monitoring, enabling your team to acquire actionable insights.

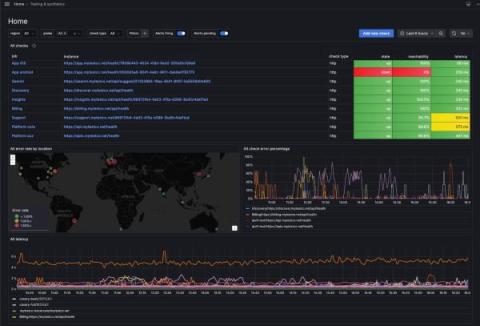
Grafana Cloud Synthetic Monitoring: How to simulate user journeys to ensure the best possible end-user experience

Here at Grafana Labs, we have a long-standing commitment to helping our users understand how their applications and services behave from an external point of view. This critical practice — known as synthetic monitoring — has been a key focus of ours for nearly a decade. Back in 2015, we released worldPing, our first product to help measure the user experience and improve website performance.