How to screen capture dashboards on a schedule with PowerShell

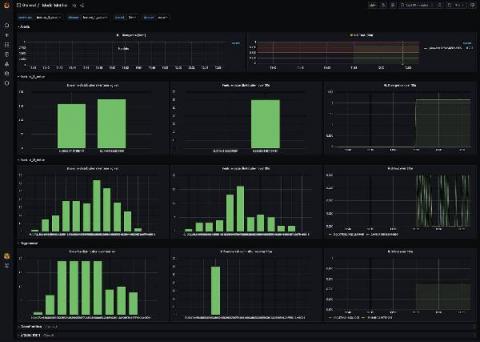
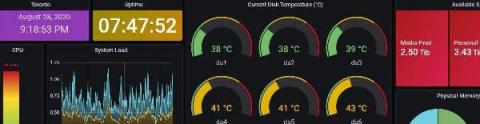
SquaredUp helps customers create dashboards that connect the dots. They do this by assisting users in visualizing and sharing data. And, for the most part, they do this by displaying in dashboards what is happening now. Of course, some visualizations show some historical values or whatnots, but tiles like the WebAPI tile only display a specific value at one particular moment in time. But have you ever wanted to “see” what your application looked like right before an outage?
R Vs Python: Which is the best data visualization language?

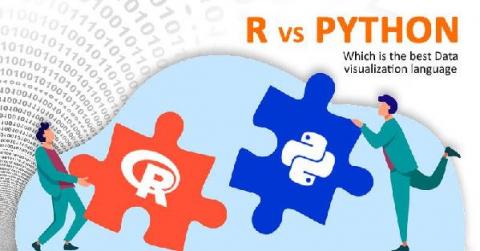
Data has gone from scarce, expensive, and hard to find and collect to rich and cheap, hard to process and understand with the digital age. In data science solutions, traditional software was used to capture, store, understand and analyze, but not all verticals of data science are essential for individuals and businesses. So Data visualization comes into play to make your tasks easy.

How to use PromQL joins for more effective queries of Prometheus metrics at scale

We recently heard that a customer, a power user of Prometheus, was grappling with 18,000 individual rules for its metrics, because its setup involved creating an individual rule group for each generated metric. Surely there was a better, more efficient way to handle this scale of metrics? In fact, we did come up with a solution, and this blog post will walk you through how you might benefit from it too.

What's new in Grafana Enterprise Logs 1.1: Label-based access control

Back in February, we introduced Grafana Enterprise Logs (GEL) into the Grafana Enterprise Stack. GEL is a new way for large organizations to ingest and query their full log volume, without the cost or operational complexity associated with other solutions. (View a demo here.) We just released GEL 1.1, and one of its key features is label-based access control (LBAC).

Dashboard Studio Tips: What's New in 8.2.2106

Here on the Splunk Dashboards team we take your feedback seriously. While we can't get to every request right away, we do add most requests to the backlog so we can roll your feedback into the product. In this blog post, we'll cover new features and improvements to Dashboard Studio in Splunk Cloud Platform 8.2.2106 based on feedback from you, our customers.

How BasisAI uses Grafana and Prometheus to monitor model drift in machine learning workloads

Qiao Han is a Software Engineer at BasisAI and co-author of Boxkite. He is interested in everything related to observability and has contributed to popular open source projects like libcurl and aiohttp. This post is written together with his coworker Linh Nguyen, who is a Tech Lead at BasisAI.

How we're working with the Elastic team to make the Elasticsearch data source for Grafana even more powerful

Back in March, we announced that Grafana Labs was partnering with Elastic to build an official Elasticsearch plugin for Grafana. As our CEO Raj Dutt wrote at the time, our “big tent” philosophy “means that we want to support data sources that our users are passionate about. Elasticsearch is one of the most popular data platforms that can be visualized in Grafana.”

The Top 21 Grafana Dashboards & Visualisations

In our guide on the best Grafana dashboards examples, we wanted to show you some of the best ways you can use Grafana for a variety of different use cases across your organisation. Whether you are a software architect or a lead DevOps engineer, Grafana is used to make analysis and data visualisation far easier to conduct for busy engineering and technical teams throughout the world.

Grafana Labs joins the CNCF Governing Board as a Platinum member of the open source foundation

At Grafana Labs, we are proud to be one of the largest code contributors to Cloud Native Computing Foundation projects. We are currently the leading company contributor to Prometheus, and also make substantial contributions to Cortex, Thanos, Jaeger, and OpenTelemetry. Our own open source projects — Grafana, Grafana Loki, and Grafana Tempo — have also become fundamental parts of the cloud native ecosystem.