Have you heard about using the hash ring in Loki and Cortex? Here is a short version: In Cortex and Loki, the ring is a space divided by tokens into smaller segments. Each segment belongs to a single “ingester” (component in Cortex and Loki that receives data) and is used to shard series/logs across multiple ingesters. In addition to the tokens, each ingester also has an entry with its ID, address, and the latest heartbeat timestamp updated periodically.
Grafana’s plugins are a quick and simple way to extend Grafana’s dashboard plugins and data sources.
Today, we are announcing the Grafana Cloud Agent, a subset of Prometheus built for hosted metrics that runs lean on memory and uses much of the same battle-tested code that has made Prometheus so awesome. At Grafana Labs, we love Prometheus. We deploy it for our internal monitoring, use it alongside Alertmanager, and have it configured to send its data to Cortex via remote_write. Unfortunately, as we scale to handle more load, our deployment becomes more and more difficult to manage.
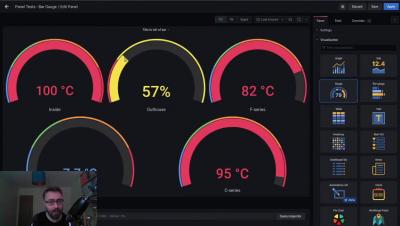
The Grafana v6.7 stable release includes improvements to Authorization and Enterprise reporting as well as a new plugin for Google Sheets. Check out the details below.
With every tech company on Earth suddenly pretending they’re remote-friendly overnight, there are a lot of posts about how to work well from home. As a matter of fact, we wrote our own, so why would we write another? The answer is: kids.
Most software architects and developers know that they need to monitor their systems. What often prevents them from implementing an effective monitoring solution is the plethora of choices they face. To set up a monitoring solution, you first have to decide what you want to monitor and how you want to monitor it. Then you have to settle for a collection and storage method. Next, you have to implement the interesting metrics in your system and start collecting them.