Operations | Monitoring | ITSM | DevOps | Cloud

DevOps

The latest News and Information on DevOps, CI/CD, Automation and related technologies.

Better learning from incidents: A guide to incident post-mortem documents

If you’re just starting out in the world of incident response, then you’ve probably come across the phrase “post-mortem” at least once or twice. And if you’re a seasoned incident responder, the phrase probably invokes mixed feelings. Just to clarify, here, we’re talking about post-mortem documents, not meetings. It’s a distinction we have to make since lots of teams use the phrase to refer to the meeting they have after an incident.

Virtual Kubernetes Clusters - Tips and Tricks - Civo Navigate NA 2023

Explore the world of virtual Kubernetes clusters in this comprehensive session from Rich Burroughs and Carl Montanari. Dive deep into Kubernetes multi-tenancy models, understand the power of vcluster, and uncover ten essential tips and tricks to optimize your virtual cluster experience.
Sponsored Post

Status Pages 101: Everything You Need to Know About Status Pages

Status Pages are critical for effective Incident Management. Just as an ill-structured On-Call Schedule can wreak havoc, ineffective Status Pages can leave customers and stakeholders, adrift, underscoring the need for a meticulous approach. Here are two, Matsuri Japon, a Non-Profit Organization and Sport1, a premier live-stream sports content platform, both integrate Squadcast Status Pages to enhance their incident response strategies discreetly. You may read about them later. Crafting these Status Pages demands precision, offering dynamic updates and collaboration.

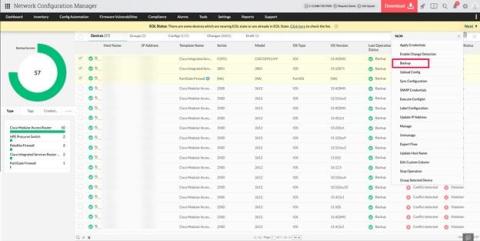
Streamlining network efficiency: Unveiling the power of ManageEngine Network Configuration Manager

Configurations play a crucial role in any network setting, as even a minor mistake in a single line of code can lead to cascading network failure throughout an entire organization. Moreover, with the increasing intricacy of networks, the risk of unauthorized misconfigurations has emerged as a significant concern, predominantly stemming from human inaccuracies.

Failing in the Cloud-How to Turn It Around

Success in the cloud continues to be elusive for many organizations. A recent Forbes article describes how financial services firms are struggling to succeed in the cloud, citing Accenture Research that found that only 40% of banks and less than half of insurers fully achieved their expected outcomes from migrating to cloud. Similarly, a 2022 KPMG Technology Survey found that 67% of organizations said they had failed to receive a return on investment in the cloud.

Cycle's New Interface Part III: The Future is LowOps

We recently covered some of the complex decisions and architecture behind Cycle’s brand new interface. In this final installment, we’ll peer into our crystal ball and glimpse into the future of the Cycle portal. Cycle already is a production-ready DevOps platform capable of running even the most demanding websites and applications. But, that doesn’t mean we can’t make the platform even more functional, and make DevOps even simpler to manage.

Netdata, Prometheus, Grafana Stack

In this blog, we will walk you through the basics of getting Netdata, Prometheus and Grafana all working together and monitoring your application servers. This article will be using docker on your local workstation. We will be working with docker in an ad-hoc way, launching containers that run /bin/bash and attaching a TTY to them. We use docker here in a purely academic fashion and do not condone running Netdata in a container.

Run Azure Functions locally in Visual Studio 2022

Azure Functions offers a serverless solution that streamlines the development process, minimizes infrastructure overhead, and results in cost savings. The beauty of this approach is that you no longer need to grapple with server deployment and maintenance; the cloud infrastructure automatically furnishes the essential resources to support your applications.

Netdata Processes monitoring and its comparison with other console based tools

Netdata reads /proc//stat for all processes, once per second and extracts utime and stime (user and system cpu utilization), much like all the console tools do. But it also extracts cutime and cstime that account the user and system time of the exit children of each process. By keeping a map in memory of the whole process tree, it is capable of assigning the right time to every process, taking into account all its exited children.