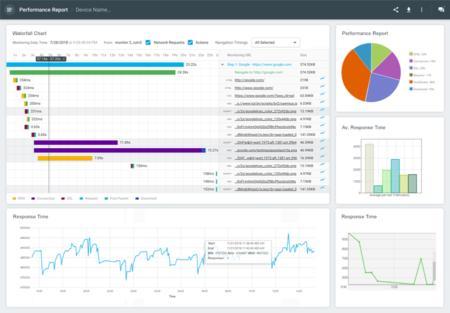
Waterfall charts are diagrams which represent how website resources are being downloaded, parsed by the engine, in a timeline that gives us the opportunity to see the sequence and dependencies between resources. It assists in identifying where important events happened during the loading process. They can also let the user easily see how good or bad the performance of their website is, showing you exactly what is slowing down your site.
Ever since a JPEG created by the digital artist Beeple sold for more than $69 million in 2021, the worldwide obsession with NFTs (non-fungible tokens) that represent digital collectibles, art, and media has been growing. A company at the forefront of the NFT world is the blockchain gaming studio Dapper Labs, which leverages blockchain to build addictive games (such as CryptoKitties), verify authentic digital collectibles, and run fan tokens for sports personalities and music artists.
In the freshly released Grafana 8.4, we’ve enabled the full-range log volume histogram for the Grafana Loki data source by default. Previously, the histogram would only show the values over whatever time range the first 1,000 returned lines fell within. Now those using Explore to query Grafana Loki will see a histogram that reflects the distribution of log lines over their selected time range.
A summary is a metric type in Prometheus that can be used to monitor latencies (or other distributions like request sizes). For example, when you monitor a REST endpoint you can use a summary and configure it to provide the 95th percentile of the latency. If that percentile is 120ms that means that 95% of the calls were faster than 120ms, and 5% were slower. Summary metrics are implemented in the Prometheus client libraries, like client_golang or client_java.
When there’s a cardinality explosion, it can cause problems: It’s a surprise, it’s noise, and it can increase your costs or cause performance degradation of your systems. Over the past year, we’ve improved our time series storage systems so that under normal use, high cardinality is no longer an issue. But as the operator of an observability platform, you should have tools you need to help protect that infrastructure.
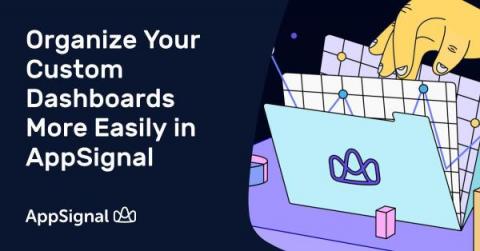
We're happy to announce that we've added a feature that will enable you to create folders for your custom metric dashboards.