Logit.io Announces The Beta Launch Of Hosted Grafana

We are pleased to announce the beta launch of hosted Grafana in addition to our existing ELK as a Service & hosted Open Distro services. As organisations around the world are constantly looking for ways that they can ensure compliance is being upheld, speeding up Mean Time To Repair (MTTR) and reducing the risk of DDoS attacks, managed Grafana forms a vital role in improving metrics observability across the entirety of your infrastructure.

Introducing Pre-Installed Logz.io Metrics Dashboard Bundles

We are proud to announce the launch of direct dashboard uploads with Logz.io. These new metrics dashboard templates are available for 25 different tools and more to come. Each of these templates is now available to Logz.io customers and covers the gamut of popular monitoring tools used by DevOps teams. Some of these tools also include multiple options. The process is simple. Head into the Logz.io app and head to your metrics account.

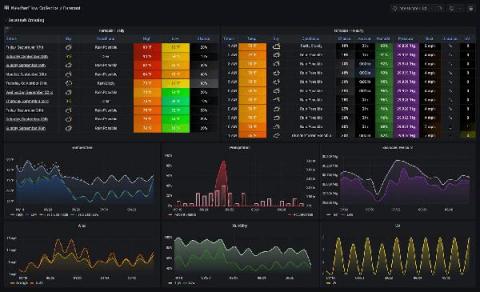
How to visualize real-time data from an IoT smart home weather station with Grafana dashboards

One of the experiences I’ve truly enjoyed over my first year as a senior solutions engineer here at Grafana Labs has been learning from our community and customers about their own Grafana journeys. I’ve been impressed by some remarkable dashboards for home automation, personal health data visualizations, family Minecraft statistics, and energy usage projects.

What Are the Limitations of Dashboards?

For modern businesses faced with increasing volumes and complexity of data, it’s no longer efficient or feasible to rely on analyzing data in BI dashboards. Traditional dashboards are great at providing business leaders with insights into what’s happened in the past, but what if they need actionable information in real time? What if they want to use their data to estimate what may happen in the future? Companies are taking notice.

Grafana vs Kibana: The Updated Guide For 2022

If you have any experience with comparing open source data visualisation tools then it is very likely you will have encountered both Kibana and Grafana during your research and discovery phase. As two of the most popular solutions for logs and metrics analysis, it can be difficult to distinguish between the two and make the choice to use either Grafana or Kibana depending on the analysis task at hand.

How Sitech builds modern industrial IoT monitoring solutions on Grafana Cloud

Chemelot is an industrial park in the Netherlands with more than 150 companies in chemical and process industries that are working to build the most sustainable and competitive chemical site in Western Europe. Sitech Services is part of making that happen. The Dutch technology firm brings together maintenance and engineering specialists with data scientists to create multidisciplinary solutions that achieve optimal safety, efficient infrastructure, and efficient processes for the plants.

With Grafana and InfluxDB, CSS Electronics visualizes CAN IoT data to monitor vehicles and machinery

Martin Falch, co-owner and head of sales and marketing at CSS Electronics, is an expert on “CAN bus” data. Martin works closely with end users, typically OEM engineers, across diverse industries (automotive, heavy-duty, maritime, industrial). He is passionate about open source software and has been spearheading the integration of the CANedge with InfluxDB databases and Grafana telematics dashboards.

How we use Grafana and Prometheus to monitor the traffic of our many GitHub repositories

If you want to understand the popularity of your GitHub repositories, knowing the number of stars isn’t enough. GitHub understands this, and that’s why the team released traffic insights. Anyone with push access to a repository can view these insights, which include: full clones, visitors from the past 14 days, referring sites, and popular content in the traffic graph.

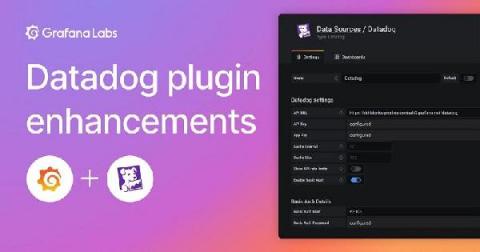
How the new Datadog plugin enhancements extend interoperability for our customers

At Grafana Labs, we have a “big tent” philosophy: We believe our users should be able to determine their own observability strategy and choose their own tools, so we help users bring different data sources together. Datadog is a powerful product used by many teams, and we hear a lot from customers about how we should further embrace and support this critical data source — which is why we created the Datadog data source plugin a few years ago.