Companies are always looking for transparency and visibility when it comes to monitoring, but as monitoring requirements and methods evolve, it’s not always easy to keep up. That’s why Opsdis, an observability consulting company based in Göteborg, Sweden, was founded. The firm focuses solely on helping clients implement systems for monitoring and metrics so they can keep up with the ever-expanding world of cloud computing and containerized environments.
In my role as a software engineer at Grafana Labs, I recently worked on a project that involved generating PromQL queries. One of the ways we verified the correctness of the generated queries was with a suite of integration tests. These tests would execute the generated PromQL queries against a local instance of the Prometheus query engine with some test data, and verify the results were as expected.
Last week at Grafana Labs, we launched our new Grafana Meetup Program with our East Coast Virtual Meetup. It was a ton of fun bringing together the community for this first event in our meetup series, but the road to getting here has been quite a journey! As a community-driven company, going more than a year without any in-person events has been pretty rough on all of us Grafanistas.
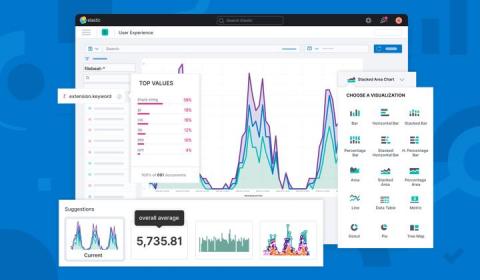
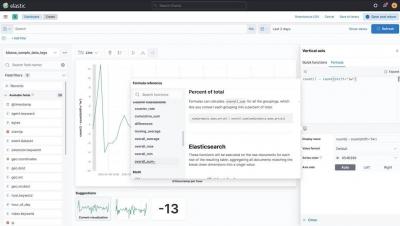
Kibana creates easy ways to do powerful things with all of your data — to ask and answer questions and follow the flow of analysis. Many times the answer to your question requires calculations based on queried data. Formulas allow you to author your own metrics by combining multiple aggregated fields using math operations. In addition, moving through and replaying your data in time and space are powerful ways to gain historical context and understand additional insight about the present.
The Worldmap panel in Grafana is an existing feature in OSS that has been widely used, but it has some limits that weren’t easily fixed. Now with the release of Grafana v8.1 , we have introduced an upgrade to the Worldmap panel with the new Geomap panel visualization that allows you to view and customize a world map using geospatial data, all while sharing the same infrastructure with our core UI.
A typical IoT application with any physical system or process in the field can have hundreds of on-site sensors generating copious amounts of data every second and possibly communicating in several different protocols.
Within the world of robotics and automation one of the most recurring needs is that of capturing and visualizing real-time data from hardware components such as sensors and actuators, which provide insights into how a system is behaving overall and helps diagnose any potential issues that might arise overtime.
At Seniorlink, we provide services and technology to support families caring for their loved ones at home. In the past two years we’ve expanded our programs across the United States, and so our need to observe our application systems has grown too.