Operations | Monitoring | ITSM | DevOps | Cloud

The latest News and Information on DevOps, CI/CD, Automation and related technologies.

The Holy Grail of Cherwell Service Request Automation

Companies are facing major difficulties as a result of the challenges posed by COVID-19, and many professionals cite automation as a key solution to business survival. However, when considering using automation to transform your service management, you need to consider how you leverage Cherwell Service Requests in partnership with automation to achieve the “holy grail” of service request automation.
Ubuntu Desktop on Raspberry Pi

Ubuntu Desktop 20.10 sees much-anticipated support for the Raspberry Pi 🍓 Download an optimised image that transforms a Raspberry Pi 4 (with 4GB or 8GB of RAM) into a complete Ubuntu workstation. This wouldn’t have been possible without the Ubuntu community, the Raspberry Pi Foundations support and their incredible hardware, and you, the users. Finally, show us that you’re using the Ubuntu Desktop on your Raspberry Pi, or what you’re using it for for a chance to win some free Groovy Gorilla 🦍goodies.

Azure Logic Apps Error Handling Using Serverless360 BAM

A few weeks ago, my good friend Josh Cook wrote a blog post for Power Automate about getting the error message when implementing the try/catch pattern with a Flow. We discussed if this could be used with Logic Apps, and Josh confirmed that it could, even though the Logic App documentation doesn’t cover it very well. Josh’s original Flow post is- Grabbing an error message from a failed run.

Best Practices for Hardware Monitoring

The biggest challenge in this regard is that a lot of the infrastructure comes from different manufacturers. While these manufacturers provide solid solutions for monitoring their hardware, it can be very difficult to oversee the monitoring of all hardware. A hardware monitoring software with an integrated console can monitor all the hardware in the server ecosystem. Hardware monitoring should be an integral part of managing a server and infrastructure.

Is unreliable software impacting on the happiness of your customers? Interlink's SRE solution might just be the answer!

Site Reliability Engineering (SRE) is playing an increasingly pivotal role in supporting hybrid-cloud, DevOps environments, where Dev teams need to release updates fast and Ops need to avoid errors and failures in production. Powered by integrations to monitoring, orchestration, provisioning and ITSM tools, Interlink’s SRE solution brings improved understanding of where threats to the health of your IT services might lurk within DevOps workflows.

What is Prometheus?

In recent times, Prometheus has become the standard for application monitoring in the tech space. But what exactly is Prometheus? Over the course of this article, we’ll touch on various subtopics to help answer this question, ranging from where it all started, to its architecture and how exactly it does monitoring. We'll address the various possible integrations/tools that can be used alongside Prometheus, and why Prometheus is a great tool for monitoring these platforms and applications.

Introduction to Performance Monitoring Metrics

The reliability and stability of your services directly depend on how well you understand the state of your infrastructure and services. A great monitoring system will allow you to understand your infrastructure better. Monitoring the performance of your system allows you to not only fix current problems but also make changes to your infrastructure to avoid them in the future.

Bringing rich and real-time infrastructure monitoring to Netdata Cloud

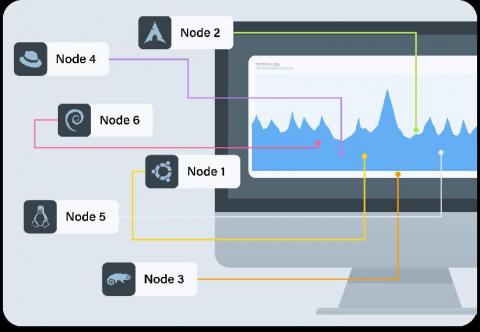
The Netdata Agent is well-equipped to solve monitoring and troubleshooting challenges for single nodes. We love that the Agent is so valuable to our users, but Netdata Cloud is designed for infrastructure monitoring. That’s why we’re working so hard to offer even more capabilities and help users monitor and troubleshoot infrastructures of all sizes, entirely for free!