Operations | Monitoring | ITSM | DevOps | Cloud

The latest News and Information on Log Management, Log Analytics and related technologies.
What Is APM? A Guide to Application Performance Monitoring

A well-instrumented service tells your on-call engineer which deploy broke checkout, which span ate the latency budget, and which line to revert before the support queue fills up. Getting there depends on how cleanly your application performance monitoring layer turns telemetry into answers. The sections ahead walk through how APM works, the metrics and components worth tracking, the cloud-native challenges at scale, and how to evaluate APM tooling against your real workload.

What Is an Incident Commander? Role, Skills, and Best Practices

The fastest incident response teams treat coordination as a craft. Someone owns the call, drives the decisions, and keeps everyone moving in the same direction while the team puts the system back together. That person is the incident commander (IC), and getting the role right is what separates your 15-minute fix from a four-hour war room where nobody’s sure who’s making the call.

Contributing Distributed Partition Ownership to the Azure Event Hub Receiver

If you're running OpenTelemetry collectors against Azure Event Hubs, distributed partition ownership and checkpointing just got significantly better. Your fleet now self-organizes. Failover is automatic. Restarts don't lose data. Here's how we got here.

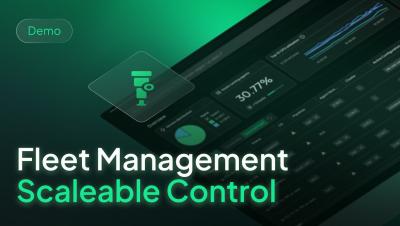
OpenTelemetry Fleet Management: Scalable Control

OpenTelemetry has turned observability pipelines into production infrastructure, but managing them at scale often creates a massive operational burden. In this demo, we show how Coralogix Fleet Management acts as the central control plane for your OTel ecosystem, providing the governance and orchestration required for modern DevOps. Stop the "manual marathon" of PRs and Helm upgrades. Move toward a safer, more predictable operating model where telemetry is consistent, audited, and scalable.

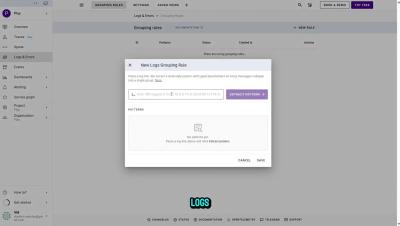
Turn Noisy Logs Into Structured Data with Uptrace Grouping Rules

Here are 3 YouTube title options plus a description optimized for technical/dev audiences: Same log pattern. Hundreds of useless groups. In this video, we show how to use Uptrace Grouping Rules to automatically turn noisy logs into structured, searchable data — without changing application code. You'll learn how to: Examples covered: Perfect for:#OpenTelemetry users, backend engineers, SREs, and anyone dealing with noisy logs.

The Best Kubernetes Monitoring Tools of 2026

Effective Kubernetes monitoring in 2026 is critical due to increased cluster scale and microservices complexity, demanding a shift toward unified observability (logs, metrics, and traces). The core focus is leveraging AI-driven features to automate anomaly detection, correlate diverse data, and significantly reduce Mean Time to Recovery (MTTR).

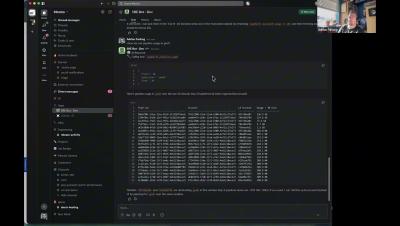
AURA in Practice: Mezmo's SRE bot, demo walkthrough

A walkthrough of the Slack-based SRE bot Mezmo's engineering team built on AURA, the open-source agent harness, running against Mezmo's own production tooling. Adrian Furlong shows the bot answering questions in a DM with tool calls visible inline, then in a shared channel where it reads the conversation before responding. He opens a fresh PagerDuty incident on camera. The webhook fires AURA, and within seconds, the agent posts a triage note back on the incident and a structured analysis in the dedicated incident channel.

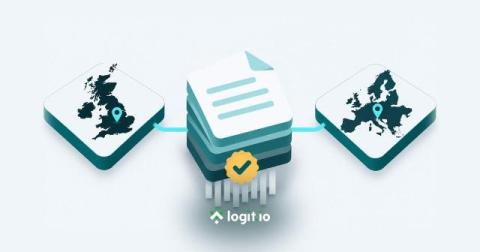
UK and EU log data residency and verified deletion

Security and procurement teams rarely ask only whether logs are searchable. They ask where those logs live, whether UK and EU estates stay apart, what happens when retention ends, and how you can show that data was deleted. This guide walks through the published region model, custom residency, and verified deletion for Logs stacks on Logit.io. Contents Start Free Trial Unlock complete visibility with hosted ELK, Grafana, and Prometheus-backed Observability Start Free Trial.

Managing OpenTelemetry at Scale: Why OTel Pipelines Need a Control Plane

OpenTelemetry made telemetry possible everywhere – turning observability pipelines into distributed production infrastructure. Distributed infrastructure requires a control plane for inventory, governance, and safe change. At 500 collectors across hybrid environments, operational overhead becomes a production risk. The moment telemetry pipelines become a distributed infrastructure, they inherit the operational problems of one.