Operations | Monitoring | ITSM | DevOps | Cloud

The latest News and Information on Monitoring for Websites, Applications, APIs, Infrastructure, and other technologies.

Get a jump on errors with Sentry and Atlassian

Recently, Atlassian announced 12 new features to help improve collaboration across software teams. These new capabilities and some help from Sentry & friends aim to help developers spend more time building the products and services their customers want. Here’s a more detailed look at how Sentry integrates with Atlassian products and leverages Bitbucket’s new Code Insights feature.

Azure Dashboards: SquaredUp vs. Azure Portal (Part 3 - Cost Management)

Previously on this Azure dashboards series, we covered making dashboards natively in the Azure portal vs. SquaredUp for Azure for VMInsights and AppInsights. In this third and final part we will be comparing our dashboard experiences when it comes to cloud cost management and visualization. We’ve already talked about the resource-level cost dashboards in the previous parts, our main goal in this one is to display costs on the subscription level. Alright, let’s jump straight into it!

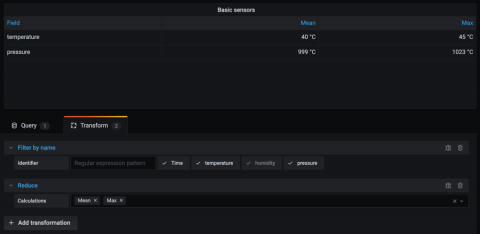
New in Grafana 7.0: Data transformations for all visualizations that support queries

Among the many new features introduced in Grafana 7.0, one of the most exciting ones is transformations. The concept of data transformation is not new to Grafana, but prior to Grafana 7, it was fairly rigid and available only in the Table panel.

IT and OT Convergence

OpsRamp and Mystic River are joining forces to bring you this interactive webinar. Can we create gateways between IT and OT? IT/OT convergence has been defined as the integration of information technology (IT) systems used for data-centric computing with operational technology (OT) systems used to monitor events, processes and devices and make adjustments in enterprise and industrial operations. But what this will look like and what is the new role of IT operations management? What is changing in IT and OT to align these worlds? This Tech Talk features our partner Mystic River Consulting, a firm with proven, repeatable service delivery methodologies and a proprietary platform that drives transformational IT project results, at a game changing speed. We’ll discuss the convergence of IT and OT and dive into a demonstration to show what’s possible with OpsRamp. Also, follow us on social media channels to learn about product highlights, news, announcements, events, conferences and more -


Current State of Development: Dashboards

Icinga Web is equipped with various features to create and manage custom views in dashboards. We’ve taken not that many users are missing some features for dashboards, like drag and drop and a better sharing functionality. To meet those needs we set ourselves the goal to increase the overall flexibility of dashboards and to add new features that improve the management and sharing functionality.

The 7 Essential Metrics for Amazon EC2 Monitoring

Amazon EC2 offers a flexible and convenient way to run virtual machines in the cloud. With dozens of EC2 instance types available, as well as multiple pricing options, it’s easy to use EC2 to configure the best cloud-based virtual machines for your needs and budget. One thing that EC2 doesn’t make very easy on its own, however, is monitoring.

Why Synthetic Monitoring is a Must for SaaS-based Solutions

Bounded to service level agreements (SLAs), vendors must monitor performance of their SaaS-based solutions for an optimal user experience. Monitoring performance of a SaaS-based solutions is a challenge since it varies extensively across user locations and geographies. These applications and their content need to travel a rigorous path of geography-specific variables (CDNs, local ISPs, etc.) en route to users. This level of complexity can eventually effect the experiences of end users differently.