You can write Playwright end-to-end testing code using JavaScript or TypeScript. Which one should you choose? When I started writing my first automated browser tests, I went with JavaScript because I couldn't be bothered with the type wrangling. I just wanted to get something off the ground quickly. YOLO, right? Today, though, there are two reasons why I last wrote a JavaScript-first Playwright test a very long time ago.
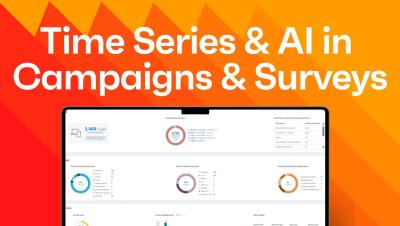
The presenter delves into advanced concepts, emphasizing the importance of time series in campaigns using bot hierarchies. They highlight the collection and branching of surveys based on user feedback, and the use of generative AI. The exploration and configuration of survey results, including filtering and splitting based on attributes, are demonstrated. The creation of custom dashboards with device data is introduced. The talk also touches on sustainability and green IT initiatives.
Application performance can make the difference between retaining or losing customers, with delays beyond a few seconds leading to dropped conversions. Performance testing and monitoring are vital for improving the overall user experience, achieving a competitive advantage, enhancing resource efficiency, enabling scalability, and reducing costs.
Understanding the nuances of marketing data is no longer a luxury but a strategic necessity; and this is where the fusion of two powerful tools, HubSpot and Power BI, takes center stage, offering an integration that transforms raw data into meaningful intelligence.
Monitoring is the most important aspect of infrastructure operations. Effective monitoring strategies help optimize infrastructure usage, improve planning, and resolve incidents quickly. While monitoring preceded DevOps, DevOps has further transformed the software development process to the extent that monitoring also has to evolve.
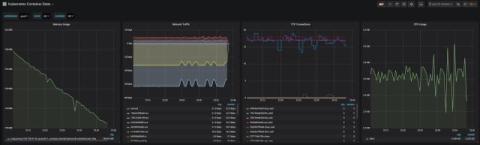
In this article, we will be looking into Kubernetes monitoring with Graphite and Grafana. Specifically, we will look at how your whole Kubernetes set-up can be centrally monitored through Hosted Graphite and Hosted Grafana dashboards. This will allow Kubernetes Administrators to centrally manage all of their Kubernetes clusters without setting up any additional infrastructure for monitoring.
Git is one of the most widely used collaboration tools in Software development. Even software developers working without teams often use Git as a version control system. Most people interact with Git through the command line, but many code editors and IDEs have Git integrations with built-in tools to make your workflow easier. Though Git is widely used, many developers only have a surface-level appreciation of all that Git has to offer.
In part I of this tutorial, we developed a Python API and used Docker and Docker Compose to containerize the application and create a development environment. In part II, we will learn more about Docker and Docker Compose and how to deploy the same app to a GKE cluster.
Kubernetes (K8s) is a popular container orchestration solution, but monitoring its performance can be quite challenging. Luckily, there's a solution that makes it easier - MetricFire. It's a cloud-based monitoring and visualization platform that provides comprehensive metrics, alerts, and dashboards for K8s clusters. The platform offers amazing cloud-based monitoring and visualization services that can make the K8s monitoring seamless.