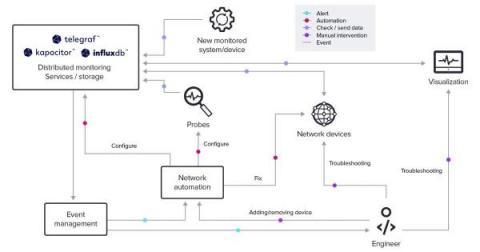
This tutorial describes how to install the Telegraf plugin as a data-collection interface with InfluxDB 1.7 and Docker. In Part 1 of this tutorial series, we covered the steps to install InfluxDB 1.7 on Docker for Linux instances. We describe in Part 2 how to install the Telegraf plugin as a data-collection interface with InfluxDB 1.7 and Docker.
InfluxDB Cloud runs natively on AWS. This is great for users that already rely on AWS because it keeps everything (or at least most things, hopefully!) in one place. This can also reduce data latency, if the region you use is geographically close to your data sources. Plus, it’s super easy to get started using InfluxDB on AWS. One of the great things about AWS is that it has a ton of different services and features that allow you to do more with your data.
Amazon re:Invent is a major technology event every year. At this year’s re:Invent, the keynote by AWS CEO Adam Selipsky made a concerted effort to draw connections between technology and some of the key challenges that people around the world, and in some cases beyond the terra firma of Earth, face. While the presentation touched on a wide range of topics, one overarching theme was the intersection of the physical and digital worlds, and the role technology plays in bridging that divide.
Tracing has always been a key use case for time series data. But admittedly, it’s also one that past versions of InfluxDB could not handle as well as we wanted. One of the roadblocks was the cardinality issue. Tracing data is, almost by definition, high cardinality data and prior to InfluxDB IOx, high cardinality data could affect query performance.
Time series data is a sequence of data points generated through repeated measurements indexed over time. The data points originate from the same source and track changes at different points in time. Times series data includes data like stock exchange data, monthly inflation data, quarterly gross domestic product (GDP) data, and logs from IoT sensors.