Explore RubyGems data with Honeycomb
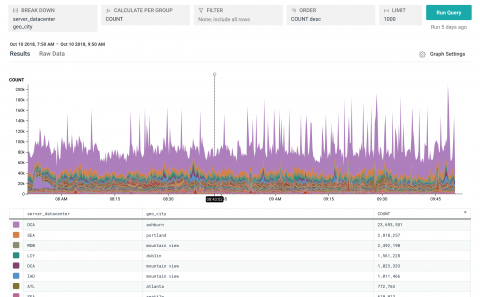
Our new RubyGems.org public dataset is now available — use it to analyze global download traffic of all gems hosted on RubyGems!


Our new RubyGems.org public dataset is now available — use it to analyze global download traffic of all gems hosted on RubyGems!
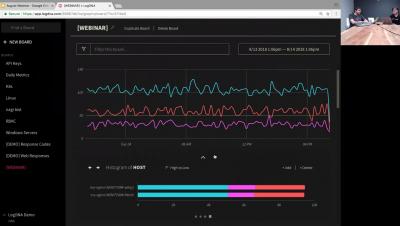
Recently, we held a webinar where Chris Nguyen, our CEO and Co-Founder and Norman Hsieh, our Head of Business Development talked about the ever increasing production of data, the shift from monitoring to observability, and the evolution of production infrastructure into multi-cloud. LogDNA is uniquely positioned to have enabled thousands of customers to gain deep insights into their evolving DevOps infrastructure.
As any business running microservices, containerized applications, networking devices, or multiple servers knows, it’s important to get a centralized log management system that fits your company’s unique needs. The best log management solution should empower your business to gain insights, resolve production issues quickly, streamline your DevOps and IT teams, and allow you to work more efficiently.
In organizations which uses a Windows server environment, the vast majority of authentication and access control processes are managed within Active Directory. As a central and critical component for managing organizational IT resources, Active Directory logs contain valuable information which must be closely monitored and analyzed.
This week we highlight Grafana project contributors from Hacktoberfest, share an article we published earlier this week on monitoring devices in your home with Prometheus and Grafana, how SoftwareMill manages their dashboards across environments and more.
What is log monitoring and log analysis? Both are crucial parts of log management and related in many capacities, but by definition, the two actually have different core meanings.
Honeycomb strives to be a fast, efficient tool; our storage back-end satisfies the median customer query in 250ms (and the P90 in 1.3 seconds). Still, every system has its limits, and customers with large datasets know that querying over a long time range, grouping by high-cardinality columns, building complex derived columns, and throwing a quantile or heat map into the mix can lead to some pretty slow queries. If this sounds familiar: good news!
Sure, thousands of technologists around the world are using Prometheus and Grafana to monitor their business systems. But how about putting these technologies to work at home? Erwin de Keijzer, a Linux engineer at the Dutch consulting firm Snow, gave a talk at GrafanaCon EU about how he used Prometheus and Grafana to monitor the power usage… of his washing machine. “This is a talk that’s a bit different scale than we’ve heard so far” at GrafanaCon, he quipped.
Addressing compliance requirements for monitoring and logging can be a challenge for any organization no matter how experienced or skilled the people responsible are. Compliance requirements are often not well understood by technical teams and there is not much instruction on how to comply with a compliance program. In this article, we’ll discuss what some of these new compliance programs mean, why they are important, and how you can comply with your logging and monitoring system.