Operations | Monitoring | ITSM | DevOps | Cloud

The latest News and Information on Monitoring for Websites, Applications, APIs, Infrastructure, and other technologies.

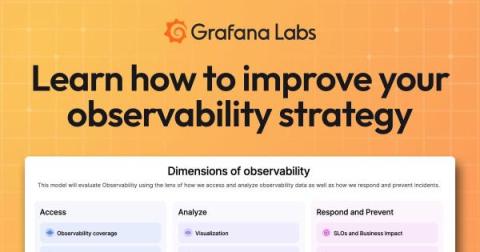
How to improve your observability strategy: Introducing the Observability Journey Maturity Model

While many segments of the IT market move quickly, the observability space seems to move at lightning speed. Fueled by open source innovation, observability toolsets and best practices constantly evolve. Sometimes, it can be tough to keep up — and even tougher to know where your own observability strategy stands. That’s the exact challenge we aim to address with our new Observability Journey Maturity Model.

The Top 15 New Relic Dashboard Examples

Among the arsenal of tools available for monitoring and managing an organisation’s mission critical applications and service, New Relic is a popular choice for many users. In our article, we will delve into the world of New Relic Dashboards, shedding light on the best use cases that demonstrate their visualisation capabilities.

Up Your Observability Game With Attributes

Splunk Observability Cloud includes powerful features which automatically identify patterns within your data to surface trends. The resulting insights tell you why some customers aren’t getting an optimal experience from your application, and how you can improve it. Unlocking these features requires attributes to be included with your application traces. But how do you know which attributes are the most valuable for your application and business?

Forward logs from Google Cloud Platform to Site24x7 with Dataflow

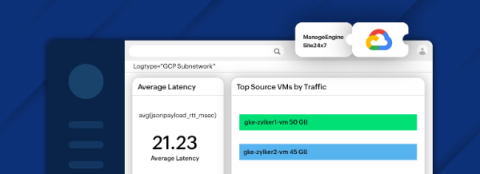
Google Cloud Platform (GCP) enables organizations to create and scale applications. Activities in applications, whether on Compute Engine or other services from virtual machines to serverless environments on GCP, produce a significant amount of logs. Logs play a crucial role in helping you achieve effective observability and troubleshooting. But the logs may experience irregular surges in data ingestion during major system events, posing challenges for network overhead.

OpenTelemetry vs Prometheus Detailed Comparison

Both OpenTelemetry and Prometheus are open-source projects under the Cloud Native Computing Foundation. OpenTelemetry is a more comprehensive observability framework with support for metrics, traces, and logs. In contrast, Prometheus is focused specifically on time-series metrics. OpenTelemetry is more versatile, and if you’re confused between choosing between the two, go for OpenTelemetry. We will delve deeper into the reason for choosing OpenTelemetry over Prometheus in this article.