Operations | Monitoring | ITSM | DevOps | Cloud

The latest News and Information on Monitoring for Websites, Applications, APIs, Infrastructure, and other technologies.

Supercharge Your Azure Savings Strategy with Azure Dev/Test Subscription

An Azure subscription is a fundamental concept in the billing and management structure of Microsoft Azure. It serves as an agreement with Microsoft to use Azure services, where the services used are either paid for or are part of a free offer.

OpenTelemetry and Grafana Labs: What's new and what's next

A new year is a natural time to reflect on past achievements — and consider future aspirations. When I think about the observability space, specifically, in 2023, OpenTelemetry felt omnipresent. It was a hot topic at every industry event, with at least one dedicated talk at ObservabilityCON, Monitorama, PromCon, and KubeCon + CloudNativeCon, both NA and EU. A notable highlight from KubeCon was OpenTelemetry going GA, marking a significant milestone in the project’s development.

Parallel Scheduling Is Now GA: Detect Regional Outages Up to 20x Faster

I am happy to announce that Checkly now supports parallel scheduling as a new way to schedule your checks. Parallel scheduling allows you to reduce mean time to detection, provide better insights when addressing outages, and give improved accuracy in performance trends, making it a powerful new feature for all Checkly users.

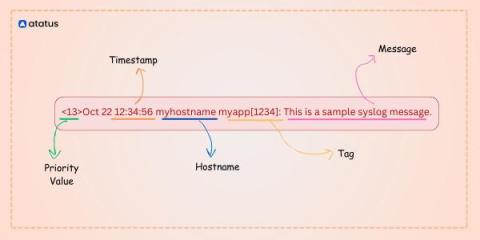
Understanding Syslog Formats: A Comprehensive Guide

Syslog, short for System Logging Protocol, is a standard protocol used to send log messages and event notifications across a network. It plays a crucial role in monitoring and managing the health, performance, and security of systems and applications. Syslog was originally developed as a part of the BSD operating system, but many other operating systems and network devices have since adopted it. One of the key aspects of syslog is its flexible and standardized message formats.

Analyzing configuration problems with Icinga 2

Today, I want to showcase an old, but still very useful, tool when it comes to analyzing and debugging an Icinga 2 configuration: the icinga2 object list command. It can be helpful in a variety of situations, for example when you want to verify that a config change has the desired effect, but also for finding out where something is set in the configuration.
Sponsored Post

5 Guiding Principles of Digital Business Observability

Modern data-driven organizations are synergizing operations observability, business intelligence, and data science with digital business observability programs that break down data silos, increase productivity, and drive innovation. Digital business observability combines IT and business data with cutting-edge data science techniques, enabling deeper analysis and unlocking valuable insights that propel innovation across use cases from sales and marketing to product design and financial operations.