Operations | Monitoring | ITSM | DevOps | Cloud

The latest News and Information on Monitoring for Websites, Applications, APIs, Infrastructure, and other technologies.

What are Spans in Distributed Tracing?

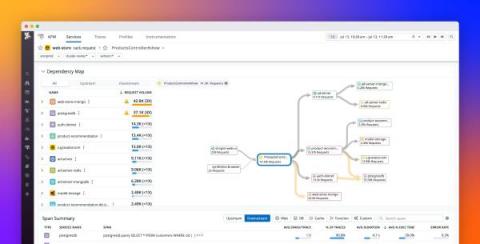
In modern software development, distributed systems have become increasingly common. As systems grow more complex and distributed, it can be challenging to understand how requests or messages move through the system and where bottlenecks may occur. This is where distributed tracing comes in. Distributed tracing is a technique that allows developers and operators to monitor and understand the behavior of complex systems.

Collecting Kubernetes Data Using OpenTelemetry

Running a Kubernetes cluster isn’t easy. With all the benefits come complexities and unknowns. In order to truly understand your Kubernetes cluster and all the resources running inside, you need access to the treasure trove of telemetry that Kubernetes provides. With the right tools, you can get access to all the events, logs, and metrics of all the nodes, pods, containers, etc. running in your cluster. So which tool should you choose?

Querying InfluxDB Cloud with the Go Flight SQL Client

InfluxDB Cloud 3.0 is a versatile time series database built on top of the Apache ecosystem. You can query InfluxDB Cloud with the Apache Arrow Flight SQL interface, which provides SQL support for working with time series data. In this tutorial, we will walk through the process of querying InfluxDB Cloud with Flight SQL, using Go. The Go Flight SQL Client is part of Apache Arrow Flight, a framework for building high-performance data services.

Error Resolution Unveiled

In today's fast-paced tech environment, swiftly and efficiently resolving software errors is essential to maintain the seamless operation of your application. A prominent problem for engineering leaders is they often need help tracking and effectively understanding their error resolution performance over time. With a comprehensive, real-time visualization of this data, making informed decisions, setting performance benchmarks, and optimizing resources become easier.

Simplifying Everyday Network Management: How AI is Changing the Game

Artificial Intelligence (AI) is the current buzz word in IT with AI promoted as the magic ingredient for improving business performance across a wide range of areas. But how, specifically, does AI enhance Network Management? The idea that computers can manage themselves is nothing new.

Shrink your IT budgets, not your observability needs

Are you getting value for every dollar spent on IT monitoring tools? Amidst the prevailing global economic turbulence, budgets are shrinking, and every dollar spent counts. However, Gartner forecasts a 5.1% growth in worldwide IT spending for 2023. Enterprises implement digital technologies to cope with layoffs and keep their systems up. The million-dollar question is: Is the monitoring output worth the cost of the monitoring solution?

Tracealyzer 4.8 Is Out

Tracealyzer version 4.8 has just been released, with major optimizations and improvements for Zephyr RTOS, and support for 64-bit target processors (FreeRTOS, Zephyr and SafeRTOS only). In addition, the ESP32 support is upgraded to use the latest TraceRecorder library, supporting all recent versions of ESP-IDF up to v5.2 dev. Snapshot tracing is now primarily supported by the implementation for streaming mode, using the RingBuffer stream port.

Open Source Monitoring vs Proprietary Software

It’s easy to get pulled into paying more and more at a major monitoring company, despite not getting the functionality that you’re looking for. Leaving your monitoring provider can be difficult because it means replacing expensive software or hardware, re-educating your team, and transferring huge amounts of data to a new system - data that may or may not be well suited to the new system. Despite these issues, there are many reasons that motivate users to move to open source.