The latest News and Information on Monitoring for Websites, Applications, APIs, Infrastructure, and other technologies.
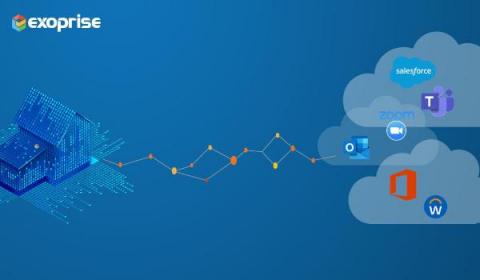
Bandwidth monitoring provides IT administrators with the assurance that the network has sufficient capacity to run business-critical applications. In addition, network ops team have end-to-end visibility to identify network hogs that cause the congestion. Typically, when a single component overloads in any network, it can bring the entire operation to its knees and impact the employee digital experience. For example, even if you may have a dedicated service plan from your ISP, employees will end up complaining about issues like large file transfer time and slower applications.
They say change is good. But in IT operations, change is also the number one cause of outages. According to the Uptime Institute, 49% of all service outages are attributed to configuration and change management errors. That's a lot of avoidable headaches. And because errors often have downstream effects, it may not be obvious what caused an outage, resulting in prolonged downtime that affects revenue-generating business services, results in service level agreement (SLA) penalties, and causes a loss of customer trust. And those costs add up quickly. Gartner figures the meter for an average downtime event runs at $5,600 per minute.
Out with the old and in with the new? Yes and no. Although 2022 may have been an interesting year for the global website monitoring market, many of the trends that dominated this year will likely carry over into 2023. Here’s a peek at how some of the top website monitoring trends of the year will likely impact security, network infrastructures and user experience going into 2023.
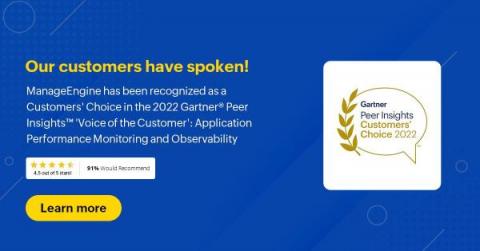
We are thrilled to announce that ManageEngine has been recognized as a Customers’ Choice in the 2022 Gartner Peer Insights ‘Voice of the Customer’: Application Performance Monitoring and Observability report for the fourth time in a row. “We believe this recognition is a testament to our customer-first mentality. For us, appreciation from our customers is one of the greatest compliments we can receive.
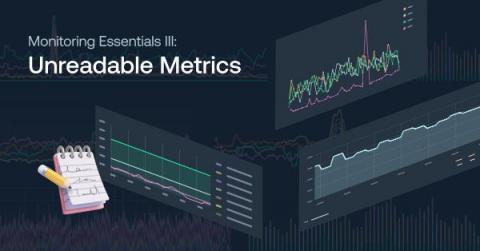
Dashboards are powerful tools for monitoring and troubleshooting your system. Too often, however, we run into an incident, jump to the dashboard, just to find ourselves drowning in endless data and unable to find what we need. This could be caused not just by the data overload, but also due to seeing too many or too few colors, inconsistent conventions or the lack of visual cues.
With the shift from traditional monolithic applications to the distributed microservices of DevOps, there is a need for a similar change in operational security policies. For example, how do you secure a disparate number of micro-systems operating with multiple access credentials across a multi-level organization? DevSecOps (Devops security) answers this question by integrating security at every level of your development process.
Having a deep understanding of a Kubernetes cluster is important: the right insights allow you to monitor the performance and health of the cluster, which is necessary for ensuring that applications are running smoothly and that any potential issues can be identified and addressed quickly. As your Kubernetes cluster develops, so does the need for monitoring and troubleshooting.