Operations | Monitoring | ITSM | DevOps | Cloud

The latest News and Information on Monitoring for Websites, Applications, APIs, Infrastructure, and other technologies.

Network Monitoring for 1,000+ Devices at Scale

A network monitoring platform can handle more than 1,000 devices, but the device total is only the starting point. A workable design must keep polling cycles on time, preserve visibility during failures, control notification volume, support the devices you own, and recover cleanly when the monitoring system itself has a problem. Crossing 1,000 monitored devices changes the job.

How eBPF Observability Monitors Docker Containers Without a Rebuild

How many containers are running in your production environment right now that nobody can see inside? A vendored service, a compiled binary, an application whose build pipeline left with the developer who wrote it: each one runs, serves traffic, and reports nothing. Instrumenting those workloads means a code change, a rebuild, and a redeploy, and on these containers none of the three are available.

Splunk Pricing in 2026: Full Cost Breakdown (and How to Cut It)

Splunk charges you in one of two ways: by how much data you send it each day, or by how much compute your searches and dashboards use. Security teams pay for both the platform and Splunk Enterprise Security, the app that turns Splunk into a SIEM, which is priced separately on top. This guide breaks down every part of a 2026 Splunk bill, works through a real, sourced pricing example, and lays out the ways to bring the number down, including the one lever many teams overlook.

SEO isn't just a marketing KPI anymore. It's a security one.

On this episode of Masters of Data, we sat down with Patrick Kobly, who runs security for a boutique MSSP serving fintech, crypto, and gaming clients, to dig into how phishing has evolved past the obvious tells. Kobly walks through how attackers spin up reverse proxies behind Cloudflare, route through residential IPs to dodge reputation-based blocking, and can take a fake domain from registration to full attack in under five hours. The conversation turns into an unexpected case for treating SEO as a security discipline, since search rank and AI-generated results are now part of the attack surface too.

From alert to answer: a hands-on investigation with trace analysis in Mezmo

Authored by Sven Delmas, VP of Research at Mezmo I wanted to know what Mezmo's new trace features feel like with real telemetry behind them, so I built the smallest honest rig I could: the OpenTelemetry demo application running in a local Kubernetes-in-Docker cluster on my machine, one collector, and one deliberately simple Mezmo pipeline.

Getting started with Microsoft Purview dashboards

Microsoft Purview is an enterprise-scale platform for managing data governance across your whole cloud estate. It is not just about ensuring the integrity of data stored in SQL databases — it spans the whole spectrum of data storage including blob storage, document databases, email and AI frameworks. It has an extensive list of features for organising and monitoring your enterprise data. This includes.

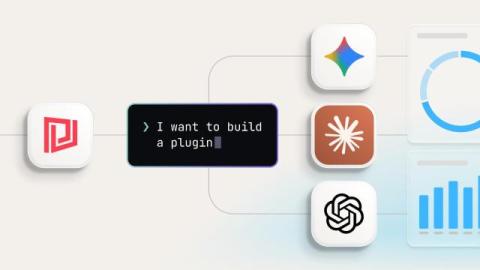
Introducing the AI toolkit - build a SquaredUp plugin from a single prompt

When we introduced the Low Code Plugin (LCP) framework in February, the premise was simple: if a system has an API, you should be able to build a plugin for it — quickly, with minimal code, and in a way you can share with the community. The "AI-ready" part was deliberate. The framework was designed to work naturally with AI assistants, so the path from idea to working integration would be as short as possible. That design decision is now paying off.

Full-Pipeline Blueprints Are Here: Source, Processors, and Destination in One Click

Blueprints launched as processor bundles, and that solved the repetitive middle of the problem. But the middle was never the whole job. You still had to know which source type to add, which parameters mattered, how to batch for your backend, and how to route it all together. That changes now. The first two cover the two requests we hear most.

How we teach LLMs to write BadgerQL

We just added two new AI features to our app: natural-language translation for Error search and Insights queries. Honeybadger has two query languages: Error search speaks a simple token syntax in the spirit of Solr or a basic Elasticsearch query, while Insights runs on BadgerQL (BQL), our own language for digging into your event data, designed to feel familiar to CloudWatch Insights and Splunk users. Both are powerful, but sometimes you just want something that works without having to open up the docs.

How to Monitor Docker Containers You Cannot Rebuild or Redeploy

How long would it take you to get one new line of code into the container running your payment service? In a lot of organizations, the answer runs to weeks, because the change has to clear a build owner, a test cycle, and a release window that nobody wants to open early. That timeline is why so much monitoring advice fails on contact. Most of it opens by telling you to add a library, rebuild the image, and push a new version. If you could do that this afternoon, you would have done it already.