Operations | Monitoring | ITSM | DevOps | Cloud

The latest News and Information on Monitoring for Websites, Applications, APIs, Infrastructure, and other technologies.

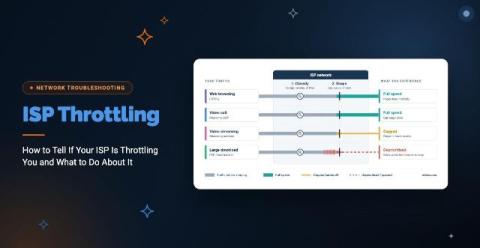
ISP Throttling: How to Tell If Your ISP Is Throttling You and What to Do About It

Your connection is fine in the morning and crawls every afternoon. Or video calls stutter while everything else loads normally. Either pattern could be ISP throttling. It could also be network congestion, or a problem inside your own network. ISP throttling is when your internet service provider intentionally slows your connection based on how much data you use, the type of traffic you send, the time of day, or the plan you’re on. Knowing throttling exists is the easy part. Proving it is harder.

Sentry's Flutter SDK 10.0: Streaming Traces and More Accurate Crash-Free Rates

Sentry’s Flutter SDK 10.0 makes streaming traces the default and changes how unhandled Flutter errors affect Release Health. Errors that leave your app running no longer mark the session as crashed, so your crash-free rate better reflects actual app crashes. The release also gives app startup its own trace on Android and iOS, simplifies logs and metrics setup, expands Dio network error capture, and respects Flutter’s sensitive-content markings in Replay and screenshots.

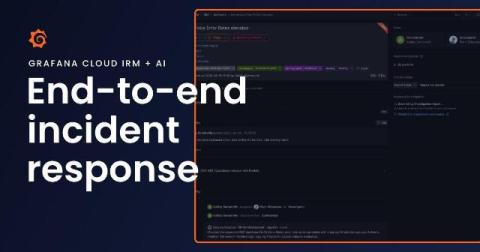
Go from alert to post-incident review with Grafana Cloud IRM and AI

You’ve got 10 minutes before your next meeting when your phone starts ringing. You’re being paged because the frontend is erroring with failed API requests. You open one tool to see what fired, then another to figure out what’s going on. You message a teammate in Slack to see if they’re noticing the same thing. That’s a lot of context switching, and it’s still how a lot of teams' incident response works today. Opening another tool and catching someone up takes time.

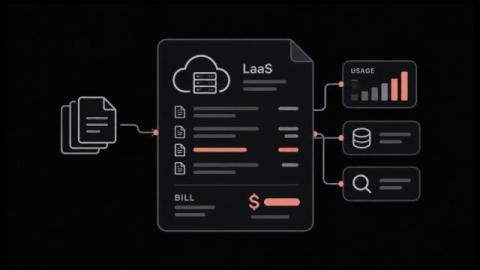
Logging as a Service (LaaS): What It Costs and When It Fits

Logging as a Service moves your log management to a provider. They collect, parse, store and search your logs for a monthly fee. The fee is where it goes wrong. Providers meter five different things, and the one written into your contract decides whether ordinary growth doubles your bill. In this blog, you'll see: By the end you'll know which meter your workload lands on. Logging as a Service is a cloud-delivered model for collecting and searching logs.

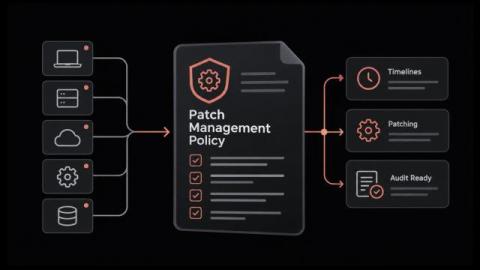
What a Patch Management Policy Should Contain to Keep Systems Secure and Audit-Ready

Who decides how fast a critical patch goes out, and who signs off when a production server can't be restarted? For many IT groups, the answer is a mix of one senior admin's judgment, an old ticket and a shared spreadsheet. It holds up fine right until an auditor asks for proof, or that admin leaves. A written policy replaces that guesswork with rules people have agreed to. Owners are named, deadlines are fixed, and there's a plan for the system that can't be patched on time.

Honeycomb Adds Another AWS Competency: Resilience Technology

We're excited to share that Honeycomb has achieved yet another Amazon Web Services (AWS) Competency—the Resilience Technology Competency—which recognizes our ability to help customers detect, investigate, and recover from failures in production systems running on AWS. While receiving the competency designation is a fantastic recognition of the capabilities of the Honeycomb platform (we also received one in Financial Services earlier this year), it's ultimately not the point.

The October 13, 2026 Microsoft 365 Global Secure Access Outage

Some users in Germany and the United Kingdom who reach Microsoft 365 through Global Secure Access (GSA) may have been unable to use Outlook, Outlook on the web, OneDrive, SharePoint Online, Microsoft Teams and Windows 365 Cloud PCs on October 13, 2026, according to Microsoft's service health updates as recorded by IncidentHub. Microsoft's final update records the start at 07:40 UTC and the end at 18:31 UTC the same day - about 10 hours 51 minutes - and narrows the geographic scope to Germany only.

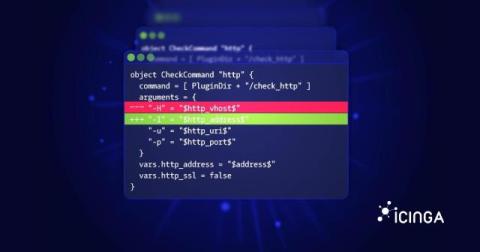
Monitoring as Code with Icinga: Approaches, Tools and Trade-offs

Monitoring as code means defining hosts, checks, thresholds and notification rules in version-controlled files, and deploying them through review and automated validation, the same way infrastructure as code handles servers and networks. With Icinga you can do this with plain configuration files in Git, the Ansible collection maintained by NETWAYS, the Puppet modules maintained by Vox Pupuli, the Icinga Director, or the REST API from tools such as Terraform.

Introduction to Digital Experience Monitoring with Grafana Cloud

Digital Experience Monitoring (DEM) in Grafana Cloud combines frontend observability, synthetic checks, and session replays with backend telemetry to give engineering teams an end-to-end view of customer experience. In this video, Senior Developer Advocate Marie Cruz gives an overview of DEM and a deep-dive demo of how it works in Grafana Cloud.

AI Agents Are Becoming Part of the IT Environment. They Need to Be Managed That Way.

Agent Studio for Edwin AI gives administrators one place to see which agents are available, understand what each one does, control which agents are enabled, and manage their access to MCP tools. See how Agent Studio brings clearer administration and governance to agentic IT operations.