Operations | Monitoring | ITSM | DevOps | Cloud

The latest News and Information on Monitoring for Websites, Applications, APIs, Infrastructure, and other technologies.

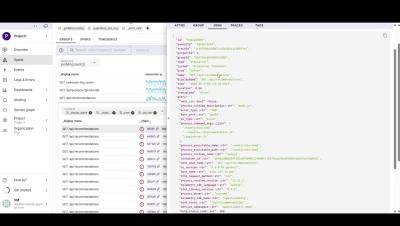
End-to-End Tracing with Uptrace: Follow Any Request Across Your Entire System

Stop guessing where requests slow down. With Uptrace, you can follow any request across your entire system and instantly see performance bottlenecks, errors, and latency sources. This video covers: Build real observability, not just dashboards.

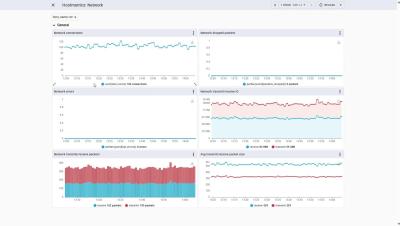
Uptrace Tutorial: Dashboards, Percentiles, Heatmaps & OpenTelemetry Metrics

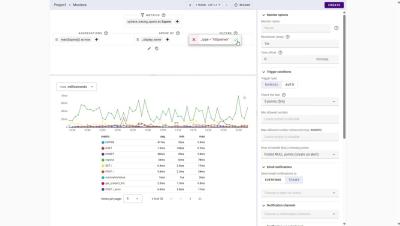
Learn how to use *Uptrace* to measure what truly matters in your applications using percentiles, heatmaps, and histograms—then turn that data into dashboards that answer questions before they’re even asked. In this tutorial, you’ll discover how to: Whether you’re setting up observability for the first time or replacing expensive monitoring tools, this guide shows how Uptrace helps you understand performance, reliability, and user experience — all in one place.

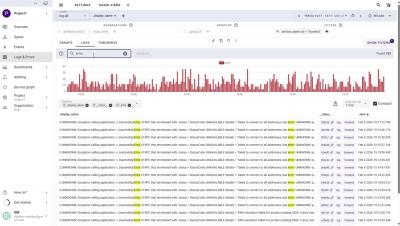
Uptrace Errors & Logs Tutorial: Capture Stacktraces, Context, and Traces in One Place

Every error tells a story — and Uptrace helps you see the full picture. In this tutorial, you’ll learn how to use Uptrace to capture errors, logs, stacktraces, and request context in a single observability platform. See how errors automatically link to traces, understand exactly what happened, and debug issues faster with rich attributes, user data, and performance impact. What you’ll learn: Understand not just *what broke*, but *who it affected and why* — and fix problems with confidence using Uptrace.

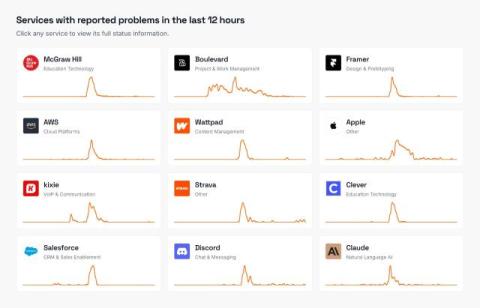
AWS CloudFront Outage (Feb 2026): Timeline, Cascade, and Lessons

At approximately 9:15 PM UTC on February 10, 2026, Amazon CloudFront began returning NXDOMAIN responses for DNS queries against specific distributions. In practical terms: DNS was telling users that services behind those distributions simply didn't exist. The root cause was a DNS resolution failure within CloudFront's infrastructure that quickly spread to eight interconnected AWS services.
Sponsored Post

From cloud costs to cloud value: The role of performance analytics in increasing ROI

Many cloud providers offer services that scale with usage. However, unanticipated overutilization of compute instances, serverless functions, or managed databases can quickly drive up costs. Managing these resources effectively is crucial for keeping cloud spending predictable.

Hosted OpenSearch MCP: query your logs from any MCP-compatible AI assistant

You have a timeout in your application logs and a question in your AI assistant: what happened to this request? Hosted OpenSearch MCP works with any MCP-compatible AI client or model. Claude Desktop and Cursor are examples. This guide covers the Basic-auth prerequisite, client configuration and a first log search you can verify against records you already recognise. Contents.

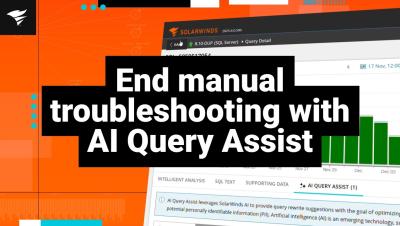
AI Query Assist for SolarWinds Database Performance Analyzer

Is your database slow? Let AI do the heavy lifting. Watch how SolarWinds DPA’s AI Query Assist transforms query tuning from a manual headache into a streamlined process. This demo shows you how to get instant, AI-powered recommendations for your worst-performing queries while maintaining the control to review and verify every fix. It’s not just about finding the problem—it’s about fixing it faster.

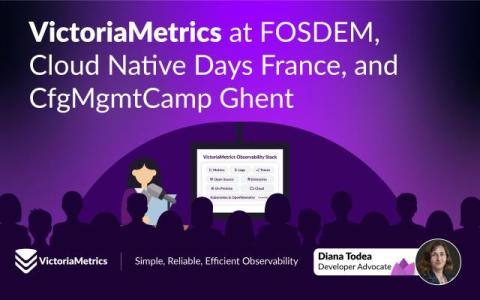
VictoriaMetrics at FOSDEM, Cloud Native Days France, and CfgMgmtCamp Ghent

Last week, members of the VictoriaMetrics team, including myself, spoke at three very different but equally important community events: FOSDEM in Brussels, Cloud Native Days France in Paris, and CfgMgmtCamp in Ghent. Each event drew a different crowd with its own expectations, making them a good way to see where open source observability stands today and how VictoriaMetrics is adapting to real-world needs. The talks we gave were snapshots of the problems we are actively working on.