Operations | Monitoring | ITSM | DevOps | Cloud

Megaport Advanced Services: From Network Design to Deployment

Network changes often stall after the design is done. See how Megaport Advanced Services helps teams move from planning to implementation and support. Ask a network team where their last big network change got stuck and you’ll rarely hear “we couldn’t work out the design.” The completed design is usually sitting in a document somewhere, reviewed and signed off. What stalls is everything needed after that. Somebody has to write the runbook. Somebody has to sit in the 2 a.m.

Best Monitoring Tools With MCP Servers for AI Coding Agents (2026)

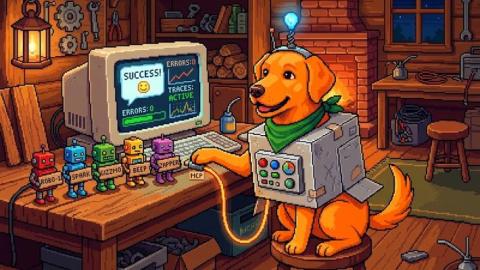
Your AI coding agent can read your code, run your tests, and open a pull request. Until recently it could not see what that code does in production. MCP servers from monitoring vendors close that gap. Connect one, and Claude Code, Cursor, or Copilot can pull the error, the trace, and the slow query behind a bug report without you copying anything out of a dashboard. Most major monitoring vendors now offer an official MCP server. But they aren’t interchangeable. Some only expose errors.

Patch Management Masterclass: From Exposure to Verified Remediation

Patching has become a race against time. As cyberthreats move from disclosure to exploitation faster than ever, IT and security teams need a smarter approach to vulnerability remediation. Watch this Patch Management Masterclass to learn how to build a risk-based patching strategy, streamline patch management across Windows, macOS, Linux, and third-party applications, and implement a closed-loop remediation process that verifies issues are resolved.

Grafana Mobile to Desktop Companion App

The Grafana Mobile App lets you triage alerts with help from Assistant from your phone. You can declare an incident or trigger an investigation into an incident in order to get more information so that by the time you get to your desktop, everything is ready for you. Grafanistas Ignacio and Florian go through a use case deep dive, demonstrating the value of the Grafana Mobile Companion app by triggering an investigation, talk to Assistant, and have all the data you need to resolve an incident - all from your phone.

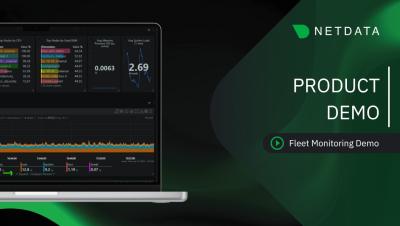
Fleet Monitoring with Netdata: Live Demo

A walkthrough of monitoring a distributed fleet with Netdata, using a simulated fleet of about 1,000 devices spread across regions. We show how the whole fleet reports into a single view: per-second metrics from every node, grouping by region and by customer, a map view that colors each device by health, filtering and saved views for different teams, and an AI-assisted investigation that scans the fleet for anomalies and points to likely causes.

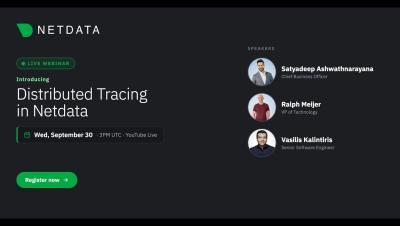
Introducing Distributed Tracing in Netdata

Netdata now supports distributed tracing. In this webinar, we'll demo the new tracing capabilities for the first time: OpenTelemetry trace ingestion, the new tracing dashboard, and the UI built to let you move from a metric anomaly to the exact span that caused it. For years, teams have asked us to close the gap between infrastructure monitoring and application performance. This release does that. Netdata can now ingest traces via OTEL, correlate them with the metrics and logs you already collect, and surface them in a purpose-built interface designed for speed and clarity.

How to Make Claude Your UI Design Companion

When I first tried Claude Design, shortly after it was released, I wasn’t impressed. As an every day Figma user, I missed the option to manipulate elements directly, especially for fine tuning details. What I overlooked at that point was the fact that it is really good at generating different options efficiently. Most of them aren’t usable, but getting these options suggested helps when exploring and combining different approaches and ideas.

Your On-Call Rotation Has a Single Point of Failure, and It Gets the Flu Every Winter

Most teams design on-call for the failures they can see in a dashboard. A region goes down, a deploy goes sideways, a certificate expires at 2 a.m. The rotation exists so that someone is always there to catch it. Far fewer teams design for the failure that takes out the catcher: the on-call engineer wakes up with a fever, and the plan for that is usually a Slack message and hope. Treat a sick engineer the way you would treat any other dependency outage. It is predictable, it is seasonal, and it has a blast radius that grows with every shortcut in the rotation design.