Operations | Monitoring | ITSM | DevOps | Cloud

Sponsored Post

5 Ways to Use Log Analytics and Telemetry Data for Fraud Prevention

As fraud continues to grow in prevalence, SecOps teams are increasingly investing in fraud prevention capabilities to protect themselves and their customers. One approach that's proved reliable is the use of log analytics and telemetry data for fraud prevention. By collecting and analyzing data from various sources, including server logs, network traffic, and user behavior, enterprise SecOps teams can identify patterns and anomalies in real time that may indicate fraudulent activity.

Add dependencies to Website, Ping, and Custom monitors

Your website or API rarely depends on just one thing. Cloud providers, CDNs, DNS, identity services, and other third-party platforms can all affect availability. That’s why we’ve added a new Dependencies tab for Website, Ping, and Custom monitors, making it easy to document the services your infrastructure relies on and quickly reference them during an incident.

Monitor your Zoom Rooms with StatusGator

Keeping meeting rooms ready for the next call is just as important as monitoring your cloud services. That’s why we’re excited to introduce our new Zoom Rooms integration. With a single connection, StatusGator continuously monitors the connectivity of your Zoom Rooms deployment, making it easy to spot offline rooms and device issues before they disrupt meetings.

Add dozens of monitors in seconds with Bulk Import

A long requested feature, Bulk import, is now live on StatusGator. Paste a list of service names or upload a.txt or.csv, and we will match them against our directory of nearly 10,000 services so you can add every monitor you need at once instead of searching for them one at a time. You will find it in the top right corner of the Service Directory above the Search bar.

The 2026 pocket guide to engineering metrics

Most engineering leaders are drowning in data but starved for insight. We have dashboards full of metrics, but they often create more questions than answers and rarely tell us what to do next. In the age of AI, where development velocity is accelerating at an unprecedented rate, this problem is only getting worse. Shipping code faster than you can fix it is an existential risk, and a dashboard that doesn't lead to action is just a distraction.

Cloud Outage Preparedness: On-Call Lessons for 2026

Cloud outage preparedness stopped being a nice-to-have this month. In a span of roughly 48 hours, Microsoft Azure lost a big chunk of its West US footprint and Amazon Web Services dropped connectivity between its us-west-2 region in Oregon and the Seattle metro. The AWS event alone rippled outward and knocked DoorDash, Reddit, Hulu, Apple Pay, Snapchat, Fortnite, and the PlayStation Network offline for millions of users, according to incident trackers. Neither outage was caused by anything exotic.

Closing the AI gap: How next-generation knowledge access unlocks mission outcomes for government

A recent IDC Spotlight report based on a survey of 685 public sector respondents found that 72% describe scaling AI from pilot to production as "very" or "somewhat" difficult.¹ Choosing the right model is only part of the challenge. Agencies also need to get their data ready for AI.

Ubuntu 26.04 LTS Resolute Raccoon is Now Supported!

We are excited to announce support for Ubuntu 26.04 LTS Resolute Raccoon on all Cloud 66 products, including registered servers. From this point onward, new applications are provisioned on Ubuntu 26.04 by default, on both x86_64 and ARM64. Don't forget, you can control your target Ubuntu version via the selection dropdown when scaling up via the UI, or through your manifest!

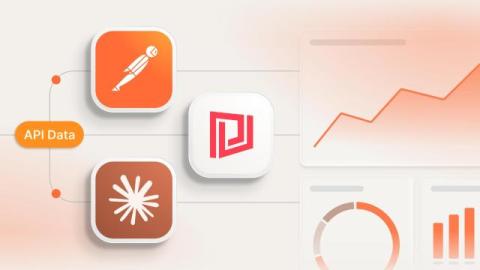
The best ways to visualize API responses in 2026

APIs power almost everything we use today, from cloud platforms and monitoring tools to ticketing systems and internal applications. But no matter how useful an API is, the response usually arrives as raw JSON. That's perfectly fine for machines, but much less convenient for people. Whether you're debugging an endpoint, exploring a new service, or building dashboards for your team, you'll probably want a better way to visualize that data. Fortunately, there are several ways to visualize API responses.