Operations | Monitoring | ITSM | DevOps | Cloud

Latest Posts

Key metrics for monitoring Pivotal Cloud Foundry

In the first part of this series, we outlined the different components of a Pivotal Cloud Foundry deployment and how they work together to host and run applications. In this article we will look at some of the most important metrics that PCF operators should monitor. These metrics provide information that can help you ensure that the deployment is running smoothly, that it has enough capacity to meet demand, and that the applications hosted on it are healthy.

Pivotal Cloud Foundry architecture

Pivotal Cloud Foundry (PCF) is a multi-cloud platform for the deployment, management, and continuous delivery of applications, containers, and functions. PCF is a distribution of the open source Cloud Foundry developed and maintained by Pivotal Software, Inc. PCF is aimed at enterprise users and offers additional features and services—from Pivotal and from other third parties—for installing and operating Cloud Foundry as well as to expand its capabilities and make it easier to use.

Log analytics and dashboarding in Datadog

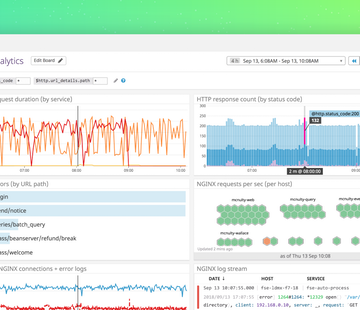
Achieving optimal performance can be challenging when you depend on separate platforms to monitor service health and to manage your logs. When data about your systems is spread across multiple platforms, investigating issues—and ultimately resolving them—takes longer and requires expertise with more tools. It takes more effort to identify real customer impact, as well as to verify that your responses to an incident are having the desired effect.

Datadog APM gains 3 superpowers: Trace Search, Service Map & Watchdog

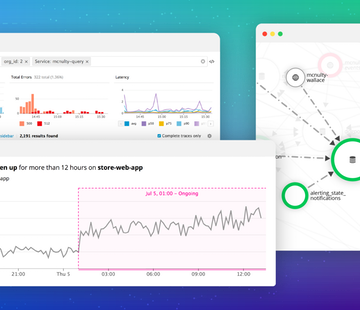
Since we made Datadog APM generally available last year, we have continually added new features and support for new languages and frameworks to ensure that you can monitor every aspect of application performance. Datadog APM helps companies such as Airbnb, Square, and Zendesk to optimize application performance and deliver top-notch customer experiences.

Key metrics for AWS monitoring

Since 2006, Amazon Web Services (AWS) has spurred organizations to embrace Infrastructure-as-a-Service (IaaS) to build, automate, and scale their systems. Over the years, AWS has expanded beyond basic compute resources (such as EC2 and S3), to include tools like CloudWatch for AWS monitoring, and managed infrastructure services like Amazon RDS for database management.

How to collect, customize, and manage Rails application logs

Logging is an important part of understanding the behavior of your applications. Your logs contain essential records of application operations including database queries, server requests, and errors. With proper logging, you always have comprehensive, context-rich insights into application usage and performance. In this post, we’ll walk through logging options for Rails applications and look at some best practices for creating informative logs.

Collecting and monitoring Rails logs with Datadog

In a previous post, we walked through how you can configure logging for Rails applications, create custom logs, and use Lograge to convert the standard Rails log output into a more digestible JSON format. In this post, we will show how you can forward these application logs to Datadog and keep track of application behavior with faceted log search and analytics, custom processing pipelines, and log-based alerting.

Auto-smooth noisy metrics to reveal trends

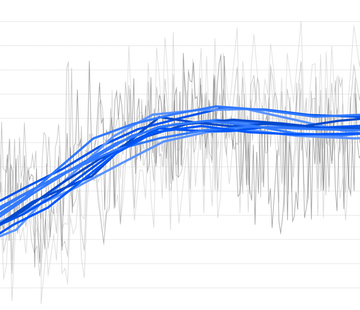
Datadog makes it easy to correlate, compare, and visualize metrics from your infrastructure and applications. Some metrics, however, are inherently so noisy that the graphs become unreadable (the dreaded spaghettification problem), and you lose the ability to extract essential information about trends and large-scale deviations. For cases like these, we provide several smoothing functions that help you identify trends in your metrics.

Introducing the Service Map in Datadog

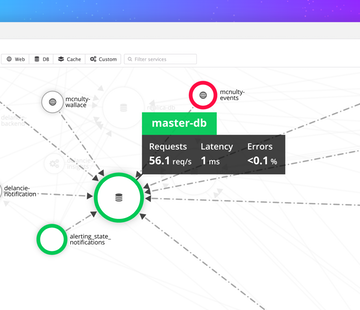
When your pager goes off at 3:00 a.m. and you need to begin your investigation, where do you start? Before you can attack the problem, you need to know the lay of the land: What else is potentially affected by this failing service? What are its dependencies? Where are the probable root causes? With the new Datadog Service Map, you can visualize the topology of your application to answer these questions and more.

Monitoring multi-cloud container storage with Portworx and Datadog

Portworx provides solutions for Kubernetes storage as well as other leading container schedulers, dramatically reducing storage, compute, and infrastructure costs for running mission-critical, multi-cloud applications with zero downtime or data loss. With Portworx, you can manage any database or stateful service on any infrastructure using any container scheduler. Portworx is trusted by many of the world’s most sophisticated IT organizations including Comcast, GE, Lufthansa Systems, the U.S.