Operations | Monitoring | ITSM | DevOps | Cloud

Latest Posts

Error Logging: A Complete Guide for Beginners

Today's applications are incredibly intricate and interconnected, often relying on numerous third-party services and libraries. With this complexity comes an increased likelihood of things going wrong. However, an error doesn't usually announce itself with great fanfare and a detailed explanation. More often than not, it shows up as an unexplained crash, a suspicious slowdown, or a surprising output. Error logging shines a spotlight on these problems.

Introducing Rollbar Analyze

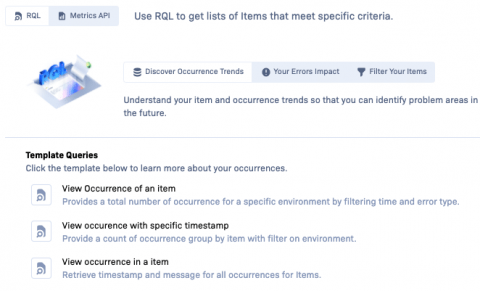
We are excited to announce the rollout of our new Rollbar Improve component, Analyze. As we strive to provide you with the best possible tools to monitor, understand, and improve your code, we've combined two powerful features, RQL and Metrics API, into one comprehensive package. Analyze is designed to deliver even more powerful insights to help your teams better understand your code and make data-driven decisions.

Using Rollbar for Performance Monitoring

Rollbar allows you to gain real-time visibility into exceptions and crashes in your applications and act on them quickly and easily. An important piece of any application is knowing if transactions are executing slower or below a certain threshold. Rollbar provides an easy method to send this data to be processed quickly and easily inside your existing Rollbar project.

How to add context to errors with custom tags

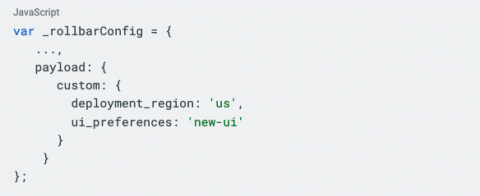
An important component of understanding the root cause of an error, and the importance of an error to the business is having additional contextual information about the error. The specific additional data that is important for your errors will be unique for your application and possibly the category of the error. Rollbar provides an easy way to tag your error data with additional custom tags. There are 2 main ways of doing this.

Introducing our new Item Detail page

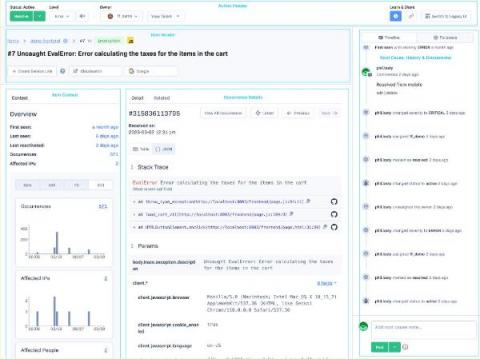
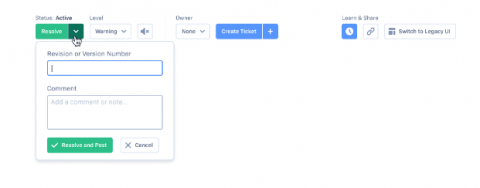
We’re excited to share a significant update to all Rollbar plans in the next few weeks. We’ve redesigned our item detail page with a new mobile layout, prioritized important error context, display occurrence details more clearly, and put all actions at your fingertips. With our new UI, we are confident you will work more efficiently, so you can resolve errors quickly and get back to your essential work.

Reducing noise in Stack Traces by collapsing non-project frames

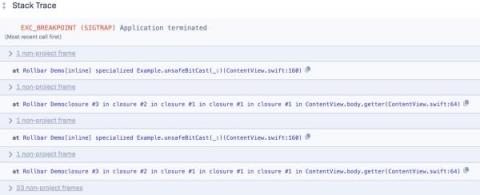
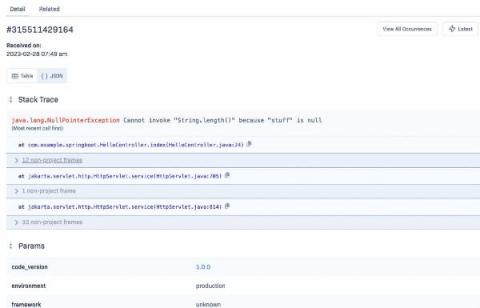
Debugging errors in your software often requires browsing stack traces (also called as backtraces or tracebacks). A stack trace is a sequence of stack frames which represents the chain of methods calling each other in your software. Rollbar collects your stack trace at the time a crash occurs – this way you will be able to know which pieces of code were active when an issue happened. You can find how to read stack traces in our previous blog post.

Caching Database Queries in SQLAlchemy - Part 1/2

The database is one of the most critical components here at Rollbar and its performance ripples across most of our SLOs. One of our goals last months has been to remove unnecessary or repetitive load from it as much as possible. Caching queries is the 101 solution whenever you need to keep scaling up while maintaining, or even reducing, database costs (very relevant these days). Here’s an example of how just one query has been drastically reduced thanks to caching.

Take control of monitoring and responding to your production Frontend Javascript errors

We are very lucky on the Rollbar Customer Engineering Team because we get to work with many many development teams. Each team develops, tests, and deploys their applications in their own way. They have chosen different languages and frameworks to solve their particular problem. We learn from each team that we work with, and share these learnings to our Product Design team.