Operations | Monitoring | ITSM | DevOps | Cloud

Error Monitoring

Announcing AI Error Resolution

After months of anticipation (and invaluable input from our beta testers!) we’re so excited to officially share AI Error Resolution. We can say firsthand that this tool helps developers resolve issues with renewed speed and accuracy, using AI-powered suggestions on the root cause of errors and how to fix them. Testing has shown how effectively this feature can pinpoint the source of an error and produce the most efficient method to resolve it, accelerating the entire debugging process.

How to detect new errors in production

How to improve your release quality by using Rollbar to detect new and reactivated errors from production, staging or qa environments. Go beyond crash reporting, error tracking, logging and error monitoring. Get instant and accurate alerts — plus a real-time feed — of all errors, including unhandled exceptions. Our automation-grade grouping uses machine learning to reduce noise and gives you error signals you can trust.

Simplify production debugging with Datadog Exception Replay

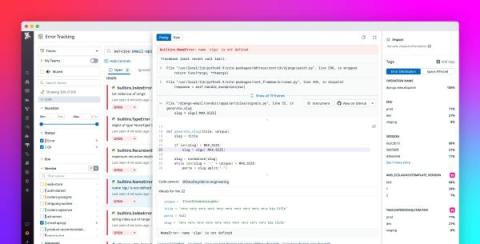
Debugging errors in production environments can frustrate your team and disrupt your development cycle. Once error tracking detects an exception, you then need to identify which specific line of code or module is responsible for the error. Without access to the inputs and associated states that caused the errors, reproducing them to find the root cause and a solution can be a lengthy and challenging process.
Sponsored Post

Symbolicating stack traces from Apple system libraries

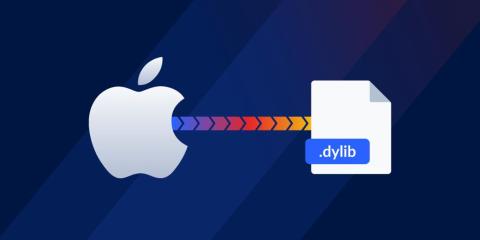
In the world of software development, quickly finding and fixing errors drives better experiences for both end-users and developers. One key tool in this process is the symbol map, which records debugging information that was lost in the compilation process. Symbol maps (or source maps if we're talking JavaScript) connect the code developers write to the minified code in production, making it easier to decipher crashes by pinpointing the exact source code that caused the error.

5 Best Frontend Error Monitoring Tools

You have so many options for frontend error monitoring today, and they all do slightly different things. We looked at everyone and did a breakdown of the most important features for frontend, the problems developers run into, end user reviews, and pricing structures to see how the best vendors stack up.

Proactive error management: Collaborate effectively and work smarter with tags

Talking to many of our customers with different needs and use cases, one particular issue comes up all the time. When I’m seeing so many error groups in my app and so many error notifications in my inbox every day, it’s easy to end up feeling overwhelmed. I want a more proactive system to alert me to which errors need attention and when, so that I can stop getting buried. Does this hit home?

Mobile iOS Error Simulator

Ready to explore Rollbar without the coding hassle? The Rollbar Error Simulator iOS app is the ultimate solution for carefree error testing, designed for users without coding experience. Seamlessly connecting to your Rollbar account, this user-friendly app lets you simulate errors effortlessly with just a single tap on a button. No technical expertise is needed! Just create a new account, opt for the Error Simulator experience, and you'll be guided.

Sentry 101: Error Monitoring For Backend Applications

Learn the basics of backend error monitoring with Sentry and recent updates to the issue experience. Whether you are using Python, PHP, Node.js, Ruby, or Go, Sentry can help you find the who, what, when and where behind errors in your backend project. Follow along with this example FastAPI project to learn how to get started monitoring for backend project errors.