Operations | Monitoring | ITSM | DevOps | Cloud

Latest News

Database Monitoring: troubleshooting from the bottom up

A healthy relationship between services and databases is fundamental to overall application performance. Unchecked database issues can compromise application efficiency, user experience, and ultimately, your organization’s bottom line. To steer clear of these consequences, monitoring your databases should be a key component of your observability—and with the launch of Coralogix Database Monitoring, it can be.

Announcing HAProxy Enterprise 2.9

HAProxy Enterprise 2.9 is now available and we’re quite excited about this one. This release includes next-generation web application firewall (WAF) and bot management capabilities, and extends HAProxy Enterprise’s legendary performance and flexibility to support applications using the UDP transport protocol. Supported by industry-leading benchmark results, these landmark features offer customers a powerful solution to the challenges of security, latency, and scale.

10 Best Tools to Manage Kubernetes Clusters

Managing multiple Kubernetes clusters presents a significant challenge, primarily due to operational overheads, complexity, and the steep learning curve associated with Kubernetes' complex ecosystem. As organizations scale and deploy across various environments; production, staging, and development, the need for a robust tool to streamline management becomes crucial.

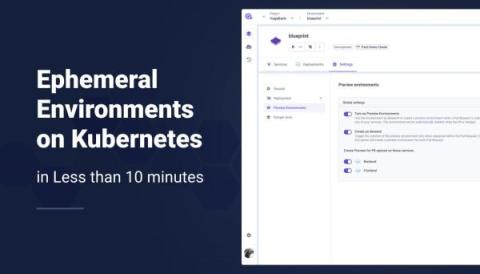
Get Ephemeral Environments on Kubernetes in Less than 10 Minutes

Qovery is an Internal Developer Platform (IDP) designed to make Kubernetes developer-friendly. It offers self-service capabilities, allowing developers to efficiently manage and scale their applications. One of the standout features of Qovery is the ability to create Ephemeral Environments, which we will focus on in this guide. So keep reading to see how you can get a fully operational Ephemeral Environments system on your Kubernetes Cluster in less than 10 minutes.

Data source security in Grafana: Best practices and what to avoid

Recently, an incorrect security report was published, claiming that there’s a SQL injection attack in Grafana. As we have communicated to the security researcher, this report is wrong. Authenticated users in Grafana have the same permissions as the user configured for the underlying data source.

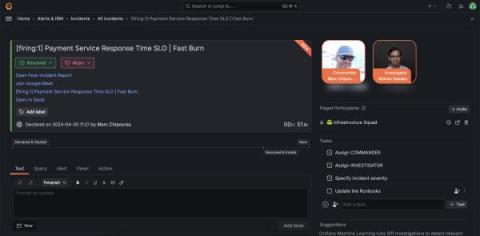
Grafana Incident: new tools for faster, simpler incident response

At Grafana Labs, we’re committed to helping teams dramatically improve how they manage and respond to incidents. Through Grafana Incident Response & Management (IRM), we provide tools to empower teams, streamline processes, and enhance the effectiveness of incident management strategies—and we’re constantly looking for ways to make our solution even better.

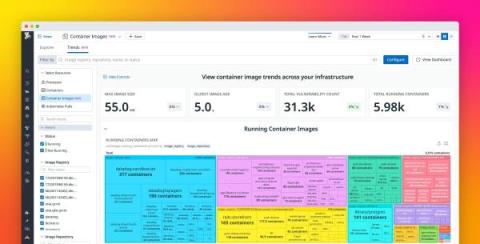
Track changes in your containerized infrastructure with Container Image Trends

Datadog’s Container Images view provides key insights into every container image used in your environment, helping you quickly detect and remediate security and performance problems that can affect multiple containers in your distributed system. In addition to having a snapshot of the performance of your container fleet, it’s also critical to understand large-scale trends in security posture and resource utilization over time.

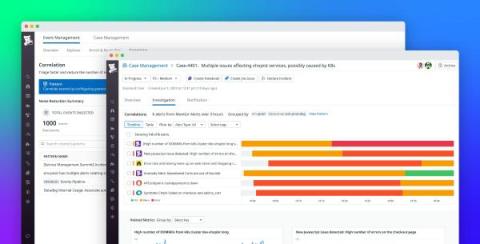
Aggregate, correlate, and act on alerts faster with AIOps-powered Event Management

Maintaining service availability is a challenge in today’s complex cloud environments. When a critical incident arises, the underlying cause can be buried in a sea of alerts from interconnected services and applications. Central operations teams often face an overload of disparate alerts, causing confusion, delayed incident response, alert fatigue, and redundant resolution efforts. These issues can negatively impact revenue and customer experience, especially during an outage.