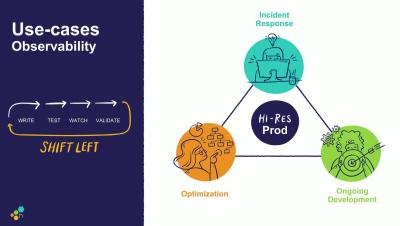
Operations | Monitoring | ITSM | DevOps | Cloud

Modern Monitoring

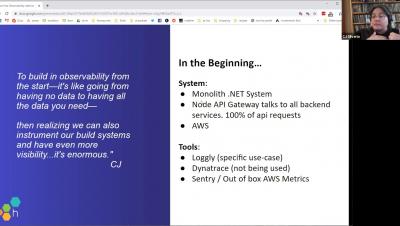
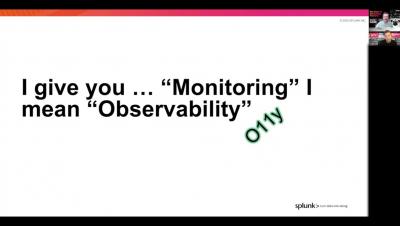
"Observability" - don't roll your eyes just yet. As application architectures change, and the relationship between applications and the infrastructure they run on is blurred, tech-enabled enterprises have to consider new practices for supporting them. Observability gives us an opportunity to embrace the new set of challenges and offer better approaches and strategies. In this episode, we talk about how the complexity of modern apps impacts the changes needed on the management plane.

Percepio DevAlert - IoT Device Monitoring and Diagnostics (brief summary)

People often have problems with IoT devices due to software issues, and the developers are largely unaware. What if IoT device developers could be notified about real-world issues in IoT devices automatically and get detailed diagnostics on the very first occurrence? This is provided by Percepio DevAlert, a novel cloud service that gives real-world feedback about issues in the device software, that allows for rapid continuous improvement and for embracing DevOps in IoT device development. Learn from real-world usage and make a great product that beats the competition.

LogicTalks - How Logicalis Intelligently Monitors and Services it's Global Customer Base

In this episode of LogicTalks, Mark Banfield, Chief Revenue Officer at LogicMonitor, sits down with Justin Cawood, Director of International Managed Services Operations at Logicalis Group, to discuss how Logicalis, a managed services provider, has evolved the way they monitor their customer's infrastructures around the globe with LogicMonitor. Justin explains how LogicMonitor has allowed them to quickly discover and onboard new clients and infrastructures, consolidate tools and learnings across the global organization, and help Logicalis' customers to transition to cloud and hybrid environments and excel while working from home.

New Product Updates What Does it Mean to Observe and Debug in 'Hi Res'

A number of Honeycomb features have been released throughout spring 2019 that, collectively, we like to say deliver “hi-res” across the Engineering and DevOps lifecycle. What do we mean? First, hi-res with Honeycomb means you get clearer visibility about how your production is behaving in real time, as you release new code. Secondly, it means once you have those insights (thanks to granular event data stored in Honeycomb), you can debug and resolve more efficiently. So, how do we do it?

Eaze into Observability

On-call teams use Honeycomb’s analytics to discover exactly what is happening with code in production. While incident response is a key reason engineers rely on Honeycomb, observability also delivers unique value during the development process. Eaze takes observability a step further and uses Honeycomb to prioritize what’s needed to stabilize their existing service while informing how they build their new Go and Node.js microservices platform all at the same time.

OpsRamp Using OpsRamp for Saas Ops Excellence

Like many of its customers, OpsRamp needs to ensure 24 x 7 availability and performance for key services and applications. Challenges include how to effectively manage multiple pods across different geographies, how to control access and security, and how to ease alert management and improve metrics such as response and resolution times. In this live video discussion, OpsRamp’s director of cloud operations, PVV Raju, shares best practices and tips from our internal use of OpsRamp.