Operations | Monitoring | ITSM | DevOps | Cloud

Latest Videos

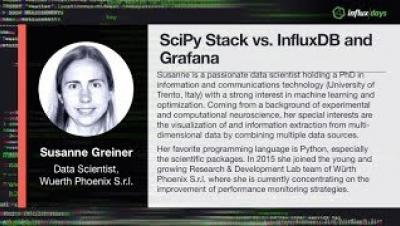
SCIPY STACK VS. INFLUXDB AND GRAFANA

Scientific python programmers adore Pandas due to its many functionalities. In particular, for data manipulation and analysis it offers handy data structures and operations for numerical tables and time series. Combined with the rest of the SciPy stack and scikit-learn (e.g. for Machine Learning Analysis), multiple goals can be achieved. When it comes to on-line data analysis, interaction, or simple data navigation by multiple users, the SciPy stack can be stressed to its limits.

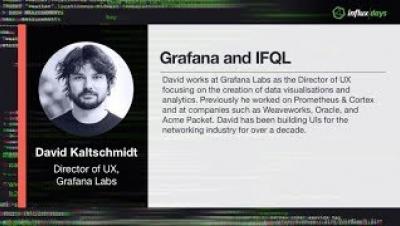
GRAFANA AND Flux

The new Flux (formerly IFQL) super-charges queries both for analytics and data science. David gave a quick overview of the language features as well as the moving parts for a working deployment. Grafana is an open source dashboard solution that shares Flux’s passion for analytics and data science. For that reason, they are very excited to showcase the new Flux support within Grafana, and a couple of common analytics use cases to get the most out of your data.

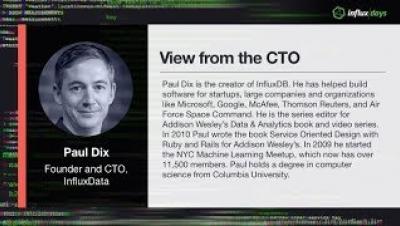
Paul Dix | INFLUXDATA PLATFORM FUTURE AND VISION

Paul will outline his vision around the platform and give the latest updates on Flux (a new Data Scripting language), the decoupling of query and storage, the impact of hybrid cloud environments on architecture, cardinality, and discuss the technical directions of the platform. This talk will walk through the vision and architecture with demonstrations of working prototypes of the projects.

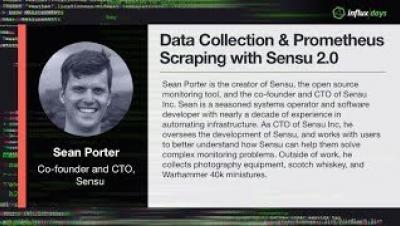
Sean Porter | DATA COLLECTION & PROMETHEUS SCRAPING WITH SENSU 2.0

Sean will demonstrate how Sensu 2.0 is designed to collect monitoring and telemetry data from these heterogeneous environments and store them in InfluxDB. Sensu 2.0 is the next release of the open source monitoring framework, rewritten in Go, with new capabilities and reduced operational overhead. Using Sensu alongside InfluxDB, Sean will go over various patterns of data collection, including scraping Prometheus metrics, and show how Sensu enables self-service data collection for service owners.

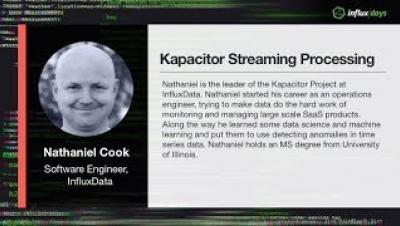
Nathaniel Cook | KAPACITOR STREAM PROCESSING

Kapacitor is the brains of the TICK Stack. Nathaniel will cover the stream processing capabilities of Kapacitor, how to process data before it gets stored in InfluxDB and after it is stored, best practices around anomaly detection and machine learning. In addition, Nathaniel will discuss how to configure the clustered version of Kapacitor.

David Cromberge | WHY YOU DEFINITELY DON'T WANT TO BUILD YOUR OWN TIME SERIES DATABASE

At Outlyer, an infrastructure monitoring tool, we had to build our own TSDB back in 2015 to support our service. Two years later, we decided to take a different direction after seeing for ourselves how hard it is to build and scale a TSDB. This talk will review our journey, the challenges we hit trying to scale a TSDB for large customers and hopefully talk some people out of trying to build one themselves because it is not easy!

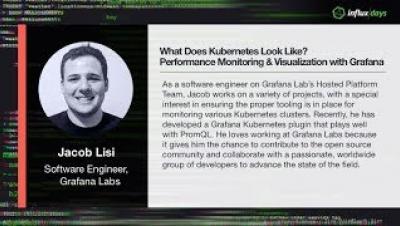
Jacob Lisi | WHAT DOES KUBERNETES LOOK LIKE?: PERFORMANCE MONITORING & VISUALIZATION WITH GRAFANA

Monitoring Kubernetes is vital to understanding the health and performance of a cluster, but which metrics are most important to add to your dashboards and alert on? Jacob will discuss how to most effectively monitor and visualize your Kubernetes cluster using the Grafana Kubernetes plugin and PromQL.