Operations | Monitoring | ITSM | DevOps | Cloud

The Place Where Modern Operations & Technology Come Together


Kubernetes Unpacked: Driving Enterprise Success with Cloud-Native
Supercharge your production timelines by watching "Kubernetes Unpacked: Driving Enterprise Success with Cloud-Native Architecture." In this video, Andreas Prins, StackState's CEO, investigates why Kubernetes has emerged as the leading OS of the cloud and delves into why businesses worldwide are choosing it as their container orchestrator.

Ivanti Neurons for HR
To view all Ivanti Demos please click here. Ivanti finds, heals, and protects every device, everywhere – automatically. Whether your team is down the hall or spread around the globe, Ivanti makes it easy and secure for them to do what they do best. Ivanti is IT for the way we work now. Integrated solutions for everything IT touches. So, employees can work better, anywhere, and everywhere.
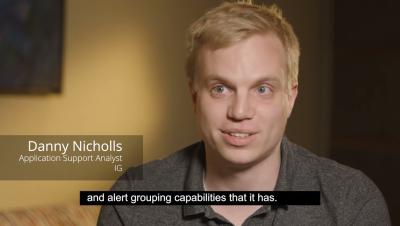
Customers Choose PagerDuty for Real-Time Operations
Organizations need a solution that’s designed for today’s dynamic digital reality. Hear customers like Carrefour Bank, IG, The Trevor Project, Vodafone, and Zoom explain how PagerDuty empowers them in an always-on, real-time world.
PagerDuty for Customer Service Operations
Provide relevant context to solve customer problems. Customer service representatives need relevant historical context in order to accurately and quickly resolve the issue at hand. Reduce the impact on your customers by layering monitoring data from technical resources across your organization with data from customer calls and other systems of record—so you have a holistic view of an issue and can identify the right solution quickly.

The Unplanned Show, Episode 17: PagerDuty's Backstage Plug-in
Did you know there's a PagerDuty plug-in for Backstage? Learn more about what Backstage is, the PagerDuty plug-in, and what's new from Head of Product for Backstage at Spotify, Meg Watson, and PagerDuty Developer Advocate, Tiago Barbosa.
Create an alert template
Create your own template for the alert summary and details using the integration's preset fields. Learn more about this ilert feature here.
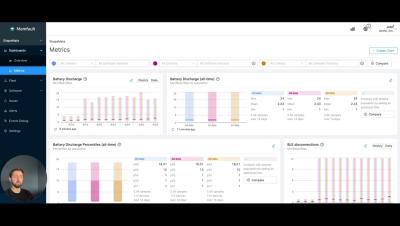
Custom Software Version Grouping | Memfault Feature Highlights
In this feature highlight video we take a quick look at the software version grouping functionality within Metrics Dashboards. Compare and measure metric health and performance across any custom grouping of software versions.

GitKon 2023 Day 1: Legendary, Free Online Developer Conference
Welcome to GitKon 2023: The Fellowship of Code, hosted by GitKraken. GitKon promises three days of insight, learning, and inspiration specifically designed to help software developers, team leaders, product and project managers, and technical executives up their game. Featuring keynotes from tech titans, Dharmesh Shah of HubSpot and Justin Cormack of Docker, and a special guest appearance by The Lord of the Rings star and mental health advocate, Sean Astin. Learn coding tips and techniques, explore emerging technologies, and get lessons in better team communication and collaboration.
Sept 13, 2023: SF Python Meetup - API Documentation: How Sentry Designed Custom Tooling
On September 13, 2023, Sentry hosted SF Python for a developer meetup in San Francisco. In this talk, Josh Ferge, Senior Software Engineer at Sentry, shared his experiences and insights on Sentry's journey of API documentation for their Django application. He talked about the various things they’ve tried, including: Schema / Example generation using dynamic tests; Writing OpenAPI JSON manually; Django Rest Framework & autodoc tooling around it; Problems with DRF serializers & performance, leading to Sentry custom implementation of schema generation using Python typing.