Operations | Monitoring | ITSM | DevOps | Cloud
Logging
The latest News and Information on Log Management, Log Analytics and related technologies.
Keeping IaC Secure: Common Security Risks in Infrastructure as Code
Infrastructure as Code (IaC) is the cloud-computing practice of putting the provisioning and configuring your cloud resources into machine-readable code.
The Best Production Monitoring Tools & Software For 2022
As a software engineer running applications in production, it is essential to monitor this environment to maintain the health of your applications. Production monitoring software and systems are used to improve observability so that you can better understand your operating environment and visualise performance issues easily.
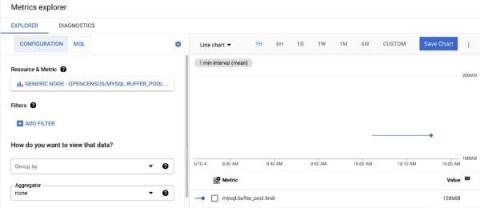
Filtering Metrics with the observIQ OpenTelemetry Collector
What Is Synthetic Monitoring? | The Benefits of Running Synthetic Tests - Sematext
An Introduction to Windows Event Logs
The value of log files goes far beyond their traditional remit of diagnosing and troubleshooting issues reported in production. They provide a wealth of information about your systems’ health and behavior, helping you spot issues as they emerge. By aggregating and analyzing your log file data in real time, you can proactively monitor your network, servers, user workstations, and applications for signs of trouble.
Announcing Logz.io Alert Manager for Metrics
Logz.io alerts are a critical capability for our customers monitoring their production environment. By keeping a watchful eye for data that indicates an issue – like spiking memory metrics or 3xx-4xx response codes – alerting quickly notifies engineers that something is going wrong. Setting an actionable alert to immediately notify engineers of oncoming problems can be the difference between a minor issue and a major event with widespread customer impact.
GrafanaCONline 2022 Day 1 recap: Grafana 9 release, Grafana OnCall open source, Grafana and Grafana Loki in space, and more!
GrafanaCONline 2022 is off to a great start with exciting news from around the Grafana-verse and a jam-packed day filled with dashboards showcasing how Grafana is used in space, in industrial IoT, at live events, and even in an effort to prevent food waste.


