Operations | Monitoring | ITSM | DevOps | Cloud

Logging

The latest News and Information on Log Management, Log Analytics and related technologies.

Cribl.Cloud Summer 2022 Release Helps You Be Even More Proud of Your Cloud

Cribl.Cloud’s Summer 2022 release is now available in an AWS cloud near you! As part of this release, we are excited to share the features we have been building, including the latest Cribl product releases (Stream 3.5 and Edge 3.5). This release brings some much-requested features that will help customers increase their compliance, reduce overall costs, and deploy a more resilient observability data pipeline.

Cribl's New Education and Certification Program Defines a Critical Role in Observability

What is an observability engineer? They build monitoring tools, right? Develop data pipelines? For time series data? Maybe distributed tracing? Ah, got it…an observability engineer is just an extension of an SRE with a wider ‘end-user’s’ perspective? But don’t they also build solutions that move telemetry for security tools? Maybe monitor and review an organization’s overall security posture?

Improve Website Performance by Checking Logs

In the early days of log analysis, application developers would use their logging libraries to write logs to files stored on a disk. After years of relying on those libraries, they found that they were unable to monitor the performance of their applications anymore because they didn’t understand the way their logging libraries worked. This led to a shift from using log files stored on a disk to using Syslog.

An Introduction to Synthetic Monitoring: Monitor the Uptime of your App and Critical Flows

In a world where the customer’s digital experience is critical to business outcomes, it is crucial to understand how our applications are behaving. As businesses increasingly rely on the performance and availability of revenue-generating applications, the tolerance for downtime and slow response times has plummeted – so the response to production issues must be quick and effective.

How to monitor Tomcat with OpenTelemetry

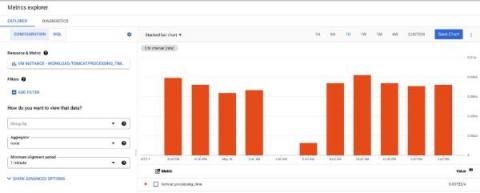
We are constantly working on contributing monitoring support for various sources, the latest in that line is support for Tomcat monitoring using the JMX Receiver in the OpenTelemetry collector. If you are as excited as we are, take a look at the details of this support in OpenTelemetry’s repo. You can utilize this receiver in conjunction with any OTel collector: including the OpenTelemetry Collector and observIQ’s distribution of the collector.

Deconstructing AIOps: Is it even real?

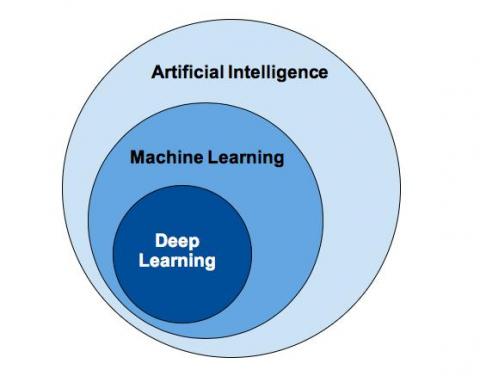
This essay explores AIOps and investigates if machine intelligence applies to IT operations (ITOps). I will dive into objection handling around artificial intelligence (AI) in pop culture and address the limitations around data sets and implicit bias coded into machines. Then, I will delve into what this means for ITOps and the ways AI-based parsing utilities can help operators and developers alike. How does Sumo Logic enable anomaly detection and identify threats?

Dashboard Studio: Level-Up Your App with Dashboard Studio

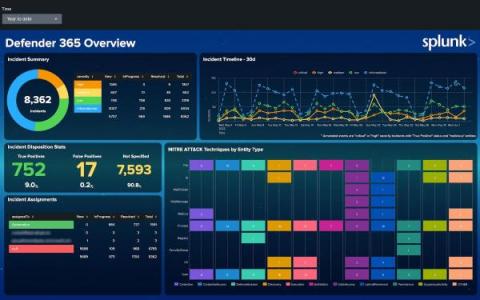
Dashboards are a powerful tool for communicating a lot of information at once. Many Splunk apps are packaged with dashboards to help you make the most of your data. For example, the Microsoft 365 App for Splunk comes with a number of dashboards to provide insights around usage, incidents, and more.

Java Debugging: Using Tracing To Debug Applications

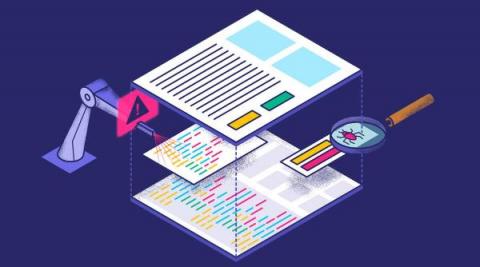
Write enough programs, and you’ll agree that it’s impossible to write an exception-free program, at least in the first go. Java debugging is a major part of the coding process, and knowing how to debug your code efficiently can make or break your day. And in Java applications, understanding and leveraging stack traces can be the game-changer you need to ship your application quickly. This article will cover how to debug in Java and how Java stack traces simplify it.