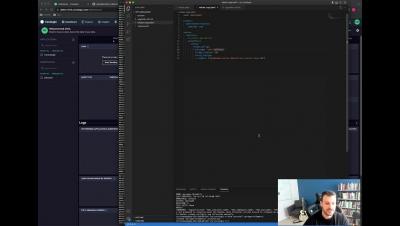
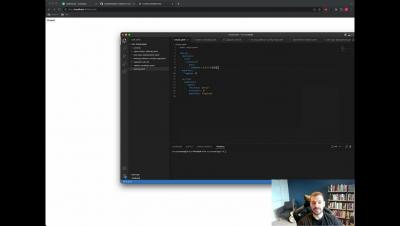
The latest News and Information on Log Management, Log Analytics and related technologies.
In part 1 of this series, we talked about zombie data and what it means for your observability architecture. In this post, we’ll talk more about how to handle all of it. How well can your organization handle the firehose of data it’s collecting? Yes, you have the ability to collect it, but chances are you don’t have the financial or human resources available to analyze all of it effectively.
Dashboards are not just tools for businesses and other organizations to monitor and respond to their data, but can be a method of storytelling. All of our data has the potential to be crafted into compelling narratives, which can easily be accomplished with the help of Dashboard Studio’s customizable formats and advanced visualization tools. We can take a series of disparate datasets and bring them together in one place if they share a common theme — in this case, Halloween.
We’ve reached the point where our ability to collect data has actually exceeded our ability to process it. Nowadays, it’s commonplace for organizations to have terabytes or even petabytes worth of data sitting in storage, waiting patiently for well-intentioned systems admins to eventually analyze it.
DevOps is an IT delivery concept that combines people, practices and tools with the shared goal of accelerating the development of applications and services. Adopting DevOps at enterprise level typically requires: The continuous development of DevOps practices, as well as other factors like the rapid pace of modern code changes, facilitates a need for DevOps monitoring: a set of tools and processes to support the entire software development lifecycle.
The real beauty of this modern, cloud-fueled, DevOps-driven world that we are living in is that it’s so highly composable. In so many ways, we’ve been freed from the limitations and structures of the previous annals of software and technology history to build things the way that we want to, and however we choose to do so.
Grafana Loki is Grafana Labs’ open source log aggregation system inspired by Prometheus. Loki is horizontally scalable, highly available, and multi-tenant. In addition, Grafana Cloud Logs is our fully managed, lightweight, and cost-effective log aggregation system based on Grafana Loki, with free and paid options for individuals, teams, and large enterprises.