Observability for Developers | Splunk
IAmDevloper and Splunk's EMEA Director of Product Marketing, Observability, and IT Markets discuss how observability is impacting customers and businesses.


The latest News and Information on Log Management, Log Analytics and related technologies.
This is a beta for the upcoming release of Graylogv5.0. Please read on for detailed descriptions of everything that is included.
Automatic UI Updates (AUIU) is a new cloud service that allows admins to get the most up-to-date UI experience between Splunk Cloud upgrades. Cloud admins gain early access to newly enhanced self-service tools through the AUIU opt-in service. Specified AUIU enhanced pages and tooling can now be delivered to customers up to three months faster. AUIU is a delivery service that allows for new UI pages and UI improvements to be integrated into Splunk Cloud deployments for specific enhanced admin pages.
How enterprises store and split up observability and security data is a great analogy to how lint, spare change, and partially-eaten bags of popcorn end up under couch cushions. Or when you tell your kids to clean up the house when company is coming over and they stash their toys and your tools in various nooks and crannies.
Organizations of all sizes rely on their observability data to drive critical business decisions. Production Engineers across Development, ITOps, and Security use it to understand their systems better, respond to issues faster, and ultimately provide more performant and secure user experiences. But while the value of observability data is well understood, teams struggle to derive value from it.
HAProxy is generally the frontend layer of your application, which means it plays a critical role since all traffic first lands on this layer. Because of this, you need to make sure everything is working at this layer all the time, as any issue can directly impact your business. Therefore, having visibility on this layer is crucial. Visibility can come from two aspects: the metrics HAProxy emits and the logs it generates while handling requests.
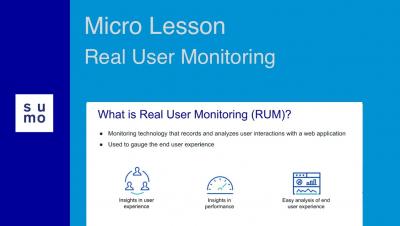
Understanding if your applications are not just available but also functioning as expected is critical for any organization. Third-party dependencies and different end-user device types means that infrastructure monitoring and application observability alone are not enough to spot and minimize the impact of application anomalies.
Microservices architecture is the new norm for building products these days. An application made up of hundreds of independent services enables teams to work independently and accelerate development. However, such highly distributed applications are also harder to monitor. When hundreds of services are traversed to satisfy a single request, it becomes difficult to investigate system issues.
Ask any cloud software team using Kubernetes (and most do); this powerful container orchestration technology is transformative, yet often truly challenging. There’s no question that Kubernetes has become the de-facto infrastructure for nearly any organization these days seeking to achieve business agility, developer autonomy and an internal structure that supports both the scale and simplicity required to maintain a full CI/CD and DevOps approach.