Operations | Monitoring | ITSM | DevOps | Cloud

The latest News and Information on Monitoring for Websites, Applications, APIs, Infrastructure, and other technologies.

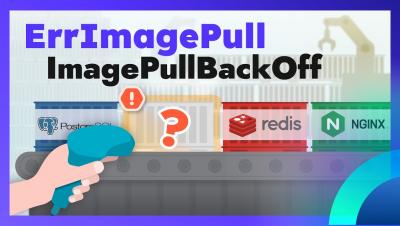
What is the ImagePullBackoff error in Kubernetes and how to fix it?

Like CrashLoopBackoff, the ImagePullBackoff is not an error but a waiting status you might see in your kubernetes pods, with the backoff time increasing after every retry. The error itself is "ErrImagePull", and it happens when there are issues when pulling the container image to the kubernetes node. So how do you solve these pull errors? Take a look at our video to get some ideas on how to resolve the various issues!

The Best OpenSearch Dashboard Examples

OpenSearch dashboards are a powerful tool for visualising and exploring data stored in an OpenSearch-compatible data store such as Elasticsearch. With OpenSearch's intuitive interface and advanced analytical tools, this visualisation tool makes it easy to gain insights into your data and monitor and alert upon key metrics. Throughout this article, we'll look at some of the most impressive OpenSearch dashboard examples that showcase it’s capabilities and versatility.

Observability vs Monitoring - The difference explained with an example

Observability vs monitoring has been a common topic in DevOps recently. There has been a lot of debate, and I have learned a lot from them when I started my observability journey. Most literature on observability is associated with a particular product or shares a textbook definition. In this blog post, I want to give you a practical understanding of observability and the differences between observability and monitoring with different scenarios and examples. We will cover the following topics here.

Tackling the Security Budget in Times of Economic Uncertainty: IT and Security Leaders Prioritize Cybersecurity

In today’s economic climate, IT and security budget owners are always looking for ways to increase efficiency while controlling costs. With tighter budgets and increasing workloads, organizations have to find ways of stretching their limited resources while making sure investments are paying off.

Querying InfluxDB IOx Using the New Flight SQL Plugin for Grafana

Grafana has been a staple visualization tool used alongside InfluxDB since its inception. With the release of InfluxDB Cloud powered by IOx, there is now a new way to integrate InfluxDB and Grafana: Flight SQL. Two of our engineers, Brett and Helen, have been working hard to create a new Grafana plugin called Flight SQL. This open-source plugin allows users to perform SQL queries directly against InfluxDB IOx and other storage engines compatible with Apache DataFusion.

The Cloud Monitoring Journey

Monitoring is not a goal, but a path. Depending on the maturity of your project, it can be labeled in one of these six steps of the cloud monitoring journey. You will find best practices for all of them and examine what companies get from each one. From classic virtual machines to large Kubernetes clusters or even serverless architectures, companies have adopted the cloud as a mainstream way to provide their online services.

Breathing easy with Grafana dashboards and 3D printing

I lead the Grafana Loki project here at Grafana Labs, and I’ve always loved building things professionally and in my personal life, whether we’re talking about metalworking or coding — or, more recently, 3D printing. A couple years ago, I purchased my first 3D printer, a Prusa i3 MK3S+. I use it periodically to build functional items I use around my house in Upstate New York. For example, I recently decided to build a solar radiation shield for my outdoor weather station.