Operations | Monitoring | ITSM | DevOps | Cloud

Observability

The latest News and Information on Observabilty for complex systems and related technologies.

How Time Series Databases Work-and Where They Don't

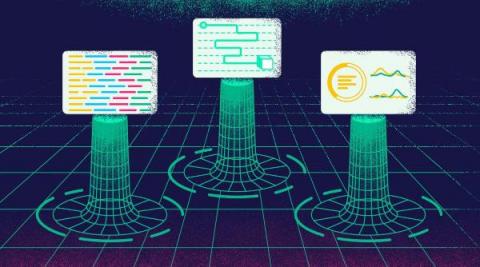
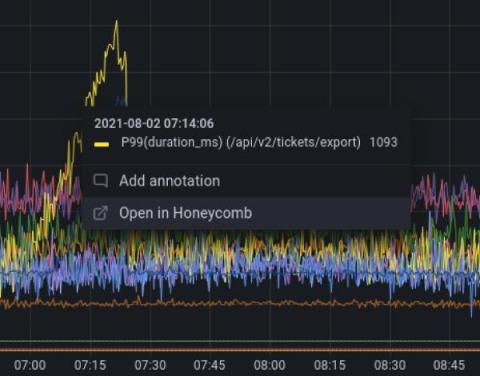
In my previous post, we explored why Honeycomb is implemented as a distributed column store. Just as interesting to consider, though, is why Honeycomb is not implemented in other ways. So in this post, we’re going to dive into the topic of time series databases (TSDBs) and why Honeycomb couldn’t be limited to a TSDB implementation. If you’ve used a traditional metrics dashboard, you’ve used a time series database.

Illuminate 2021 - Embracing open standards for big picture observability

We just wrapped up a fantastic 5th Illuminate, Sumo Logic’s user conference, filled with amazing customer speakers, partners, and Sumo Logic experts all sharing their insights and expertise. The level of engagement taking place during presentations, workshops and executive meetings showed the high level of interest in open telemetry, unified analytics and full-stack observability to solve the challenges inherent in application modernization and cloud migration.

Understanding the Three Pillars of Observability

Observability and its implementation may look different to different people. But, underneath all the varying definitions is a single, clear concept: Most software that’s run today uses microservices or loosely coupled distributed architecture. While this design makes scaling and managing your system more straightforward, it can make troubleshooting issues more difficult. The three pillars of observability are different methods to track software systems, especially microservices.

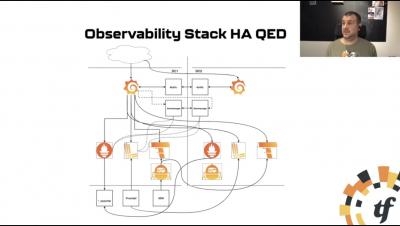
Bootstrapping a multi DC cloud native observability stack by Bram Vogelaar

An introduction to Observability and how to setup a highly available monitoring platform, across multiple data centers. During this talk we investigate how to config a monitoring setup across 2 DCs using Prometheus, Loki, Tempo, Alertmanager and Grafana. Bram Vogelaar spent the first part of his career as a Molecular Biologist, he then moved on to supporting his peers by building tools and platforms for them with a lot of Open Source technologies. He now works as a DevOps Cloud Engineer at The Factory.

Honeycomb Differentiators Series: SLOs That Tell the Whole Story

In the recent past, most engineering teams had a vague notion of what Service Level Agreements (SLAs) and Service Level Objectives (SLOs) were—mainly things that their more business-focused colleagues talked about at length during contract negotiations. The success or failure of SLAs were tallied via magic calculations (what is “available” anyway?!) at the end of the month or quarter, and adjustments were made in the form of credits or celebrations in the break room.

What is Observability?

Observability is a term that is becoming commonplace in both startups and enterprises. Log observability is different from monitoring, as it provides visualized metrics from a variety of different systems in a single pane of glass view. This is invaluable for organizations to understand the interdependencies and links between external events and internal performance.

Announcing General Availability of the Honeycomb Query Data API

The Query Data API is a Honeycomb Enterprise feature. With a Honeycomb Enterprise account, you can use this API today. Head over to our API docs to learn how to get access to your data. If you aren’t yet a Honeycomb Enterprise user, try it out by requesting an Enterprise Trial. Starting today, Honeycomb Enterprise customers can use the Honeycomb Query Data API to programmatically run queries and retrieve their results, and pull query results into any data visualization tool of their choice.