Operations | Monitoring | ITSM | DevOps | Cloud

Observability

The latest News and Information on Observabilty for complex systems and related technologies.

Multi-Cluster Observability Part 3: Practical Tips for Operational Success

This is the final article of a three-part series. To start at the beginning, read Part 1: Benefiting from multi-cluster setups requires familiarity with common variations and Part 2: Exploring the facets of a multi-cluster observability strategy. As companies scale software production, they lean on Kubernetes as a crucial container orchestration platform for managing, deploying and ensuring software availability.

[Webinar] Are your networks resilient? Learn how network observability can help.

As networks continue to evolve, monitoring methods must also adapt. The key to building resilient networks, whether in the face of cyberattacks or natural disasters, lies in their ability to withstand adverse events and quickly recover. Achieving this requires a comprehensive understanding of network activity.

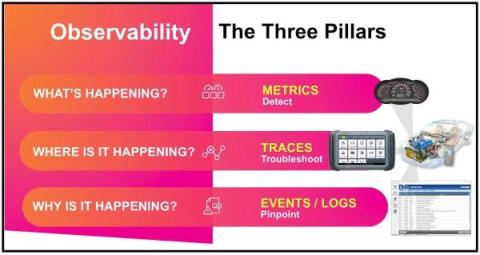
Why Is Log Data So Important In Observability?

Imagine this scenario: your platform appears to have an issue. Maybe it has gone down or maybe it has affected a large volume of users or perhaps just a few of those important ones; either way there is a significant problem with it. Users are complaining and are happy to shout about the platform not working on X (formally Twitter).

ShipHero's Observability Journey to Seamless Software Debugging

ShipHero needed a robust, cost efficient observability platform to support DevOps, customer support, and more. Committed to timely service, ShipHero recognizes that the seamless performance of its software is paramount to customer satisfaction. To maintain this high standard, the development team needs the right data at their fingertips to quickly find and solve problems as they occur.

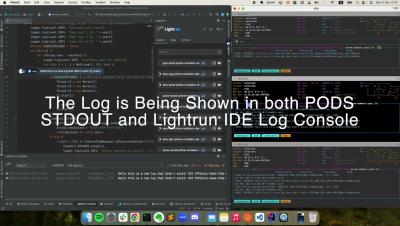
Troubleshooting K8S EKS with Lightrun Developer Observability Platform

In this demo video we show how developers can shift left observability and debug in runtime an EKS cluster from their IDE. The demo shows how developers can debug a remote Java application that is deployed on 3 different EKS pods (Dev, Staging, Production) directly from their IntelliJ IDE in runtime and add logs and snapshots.
Sponsored Post

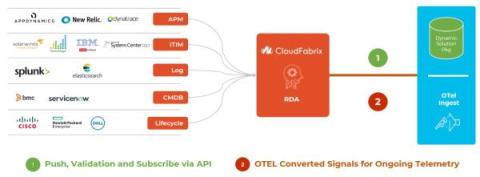
Announcing CloudFabrix's Data Fabric for Observability for Cisco's Observability Platform

CloudFabrix, the Robotic Data Automation Fabric inventor, announced “Data Fabric for Observability” with dynamic Data Ingestion and Automation service (DIA) for the Cisco Observability Platform. You can see the powerful combination in play at Cisco Live Melbourne between December 5-8th, 2023. Cisco epitomizes “Experience as the new Digital Currency” with its observability platform.

A Practical Guide to Debugging Browser Performance With OpenTelemetry

So you’ve taken a look at the core web vitals for your site and… it’s not looking good. You’re overwhelmed, and you don’t know what change to make because everything seems like too big of a project to make a real difference. There are so many measurements to keep track of and the standards cited seem even scarier. This is extremely normal. Web performance standards can feel impossible to meet for a lot of us.

Observability with Grafana Cloud: Explore the latest and greatest features

Grafana Cloud constantly evolves to include new, cutting-edge features for end-to-end observability. In fact, just last month at ObservabilityCON 2023, we made a number of updates to our fully managed observability platform, including the general availability of Grafana Cloud Application Observability, Grafana SLO, and Adaptive Metrics.