Operations | Monitoring | ITSM | DevOps | Cloud
Debugging
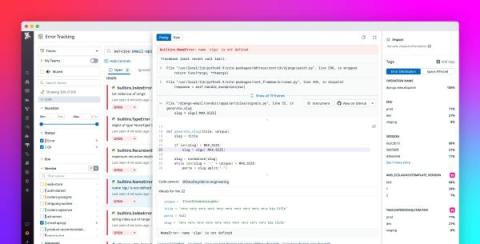
Simplify production debugging with Datadog Exception Replay
Debugging errors in production environments can frustrate your team and disrupt your development cycle. Once error tracking detects an exception, you then need to identify which specific line of code or module is responsible for the error. Without access to the inputs and associated states that caused the errors, reproducing them to find the root cause and a solution can be a lengthy and challenging process.
The 7 Most Common Python Debugging Challenges and How to Handle Them
According to PYPL (PopularitY of Programming Language), Python has been the most popular programming language worldwide from 2018 to the present. Remarkably, Python’s popularity has grown by 2.5% over the last five years. In contrast, Java, the previously most popular language, has seen a 4.8% decrease in its popularity. While Java is typically faster than Python, Python is easier to read with its simpler syntax.
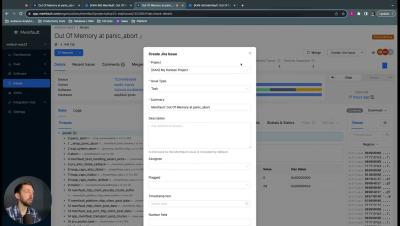
Jira Integration | Launch Week Feature Highlight
In this launch week special we are talking about our newly released Jira Integration.
Differences Between ELF-32 and ELF-64
Have you ever wondered if ELF is portable between 32-bit and 64-bit targets? Probably not, but this might be a common scenario for you if you work on 32-bit embedded devices but use a 64-bit host. Or maybe you’ve developed tooling for 32-bit MCUs and are transitioning to working on 64-bit targets. The ELF object file format is one of the most commonly used today. Most build systems provide an output to this format, and ELF is commonly used to output coredumps.
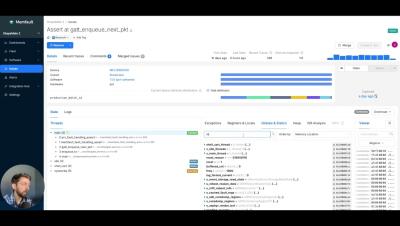
Better data, better dashboards, better drilldown | Launch Week
In this launch week special we dive into a whole set of new features we have released designed to make it easier to get insights from the data you are collecting in Memfault and streamline the process of going from top level insight to device level investigation.
Introducing Device Vitals
Memfault would like to introduce you to Device Vitals. To ensure that your product maintains its quality even after it is launched, it is crucial to monitor three key indicators for your devices in the field: stability, connectivity, and battery life. By collecting Device Vitals, you can have access to valuable data that helps you understand the overall health of your fleet and the quality of your product.
Device Vitals | Launch Week Feature Highlight
This launch week special includes an overview of our newly release Device Vitals feature set. Device Vitals gives teams the ability to measure firmware stability, battery life, and connectivity performance for any embedded device, right out of the box.
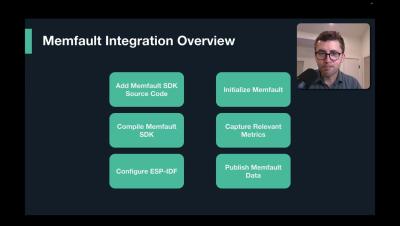
How to get Memfault Device Vitals up and running on an MCU (ESP32) - Integration Walkthrough
In this video Memfault Field CTO Thomas will walk you through each step to get your MCU based device integrated on Memfault and reporting crash data and our newly released, Device Vitals into Memfault. This walk through is using an ESP32 based device but the same principles can be applied to any MCU and we have lots of guidance available for different chipsets in our technical documentation.
Measure Embedded Device Quality in the Field with Ease
François Baldassari reveals our biggest product release yet. This pivotal launch marks a new era in IoT device performance monitoring, ensuring unparalleled insights into software stability, battery health, and connectivity— the three critical aspects of device vitality. Our latest breakthrough allows for the precise evaluation of your devices' quality, enabling swift identification and resolution of any issues. With François leading the charge, explore how our newest innovation empowers you to.


