Operations | Monitoring | ITSM | DevOps | Cloud

Debug Faster with Chrome + Rollbar Debugging Assistant

Context switching is one of the biggest hidden productivity killers in debugging. Jumping between multiple open browser tabs slows momentum and increases cognitive load, especially when you’re trying to diagnose an issue under pressure. Google Chrome's new split screen feature, paired with Rollbar Debugging Assistant, enables a faster, more focused way to troubleshoot errors without constantly losing your place.

7 Senior-Level AI Debugging Tools Compared

Every dollar spent on engineering is a bet on the future. But look at your engineering team's sprint backlog and you’ll see a non-trivial amount of that capital is spent on repairing the past. For the last ten years, if you asked a VP of Engineering what the solution was, the answer was always the same: better monitoring. Throw more telemetry at the wall. Build a bigger dashboard. Send more alerts at 3 AM. It was the only available tool, so it became the entire thesis.

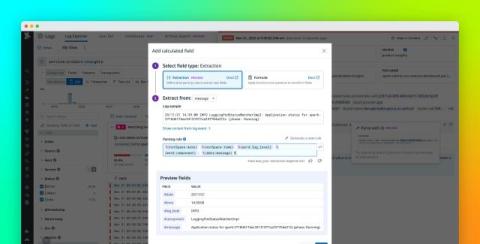
Accelerate investigations with AI-powered log parsing

When debugging production issues, investigating security incidents, or analyzing network traffic, engineers and analysts need not only to find the right logs but to make sense of all the dense, unstructured data generated by different systems. Logs rarely ship neatly laid out in a way that facilitates filtering, faceting, or graphing for every possible scenario. As a result, teams often find themselves writing regular expressions or custom parsers on the fly, which can be error-prone and time-consuming.

Coredump #018: Hidden Complexity of Sleep Tech: Power, Comfort, and 8 Hours of Reliability

In today’s Coredump Session, François and Chris from **Memfault** sit down with **Charles Taylor**, co-founder of **Ozlo Sleep**, to explore the journey from Bose’s original Sleepbuds to the rebirth of a product designed to help people truly rest. The conversation traces how Ozlo revived this beloved idea, balancing power management, all-night comfort, and reliability in one of the most demanding consumer tech categories. Along the way, Charles shares lessons from bringing a hardware product back to life, testing technology people use in their sleep, and building a community that believes better rest starts with better engineering.

Side-by-Side Variable Comparison for Snapshot Debugging

When you’re debugging a tricky issue in a distributed system, “what changed?” is often the most important question. You add logs, you capture data, you redeploy, and suddenly your browser is full of open tabs, copied JSON blobs, and screenshots of log lines. Comparing behavior between two requests, two users, or two releases turns into a manual, error-prone chore. Lightrun Snapshots were built to fix the data collection side of that story.

Installing TrackJS on Certkit

I recorded a video showing how to properly set up TrackJS for a new production website, specifically CertKit, our new certificate lifecycle management tool. The key to effective error monitoring isn’t just installing the tracking snippet, it’s configuring the system to surface real issues while filtering out the noise. I configure a forwarding domain (errors.certkit.io) to bypass ad blockers that might prevent error reporting.

#017: Building and Scaling a Startup in the Ultra-Competitive Health Wearables Market

In today's Coredump Session, François Baldassari and Chris Coleman sit down with Ultrahuman co-founder Vatsal Singhal to unpack what it takes to build and scale a hardware startup in the fiercely competitive health wearable market. From transitioning from software to hardware to building responsibly with AI and machine learning, Vatsal shares what it means to blend deep engineering rigor with a mission to improve human performance. This conversation explores the challenges, surprises, and future of health-tech innovation at the edge.

Stop Debugging Blindly! How Traffic Capture Can Help Your Code #speedscale #trafficcapture #ai

Is AI "slop" or new code pushing tons of bugs into production? You can't test everything forever. Learn how traffic capture is the most efficient way to understand how your code is actually running in the real world. By grabbing data from sidecars, packet captures, or logs, you get the context you need to prevent bugs and improve performance.

Debugging Without a Net: The Pain of Reproducing Production Issues

Every engineer has been there — a late-night page, a broken feature in production, and no clear way to reproduce it. The logs are vague. The metrics look normal. Your local environment works fine. Yet something somewhere is failing for real users. So begins the detective work — debugging a live system with almost no tools, no perfect test data, and no clone of production.