Operations | Monitoring | ITSM | DevOps | Cloud

Tracing

The latest News and Information on Distributed Tracing and related technologies.

Instrumenting Lambda with Traces: A Complete Example in Python

We’re big fans of AWS Lambda at Honeycomb. As you may have read, we recently made some major improvements to our storage engine by leveraging Lambda to process more data in less time. Making a change to a complex system like our storage engine is daunting, but can be made less so with good instrumentation and tracing. For this project, that meant getting instrumentation out of Lambda and into Honeycomb.

KubeCon Demo: A Preview of Grafana & Jaeger

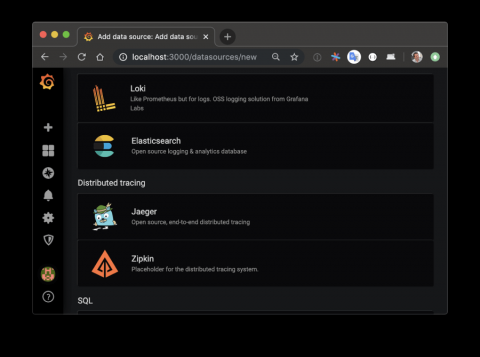
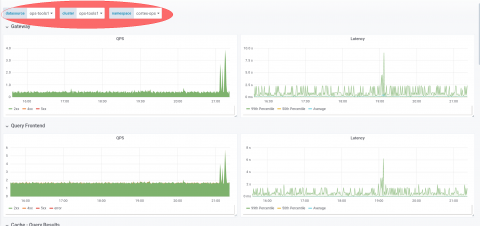
At the Grafana Labs booth at KubeCon + CloudNativeCon in San Diego this week, we showed a demo of a future feature for Grafana: distributed tracing datasources. Until now, Grafana has been bringing together metrics and logs, to be viewed side-by-side on one screen. Now we’re adding tracing, which has been a missing puzzle piece for even more observability in Grafana.

OpenTelemetry, OpenTracing, OpenCensus: An Introduction and Glossary

There’s been a fair bit of buzz lately about OpenTelemetry, which is the next major version of the OpenTracing and OpenCensus projects. The leadership of those two projects have come together to create OpenTelemetry, which combines the best parts of OpenTracing and OpenCensus to create one open source project to help with your instrumentation needs.

Using Jaeger with Eclipse Che

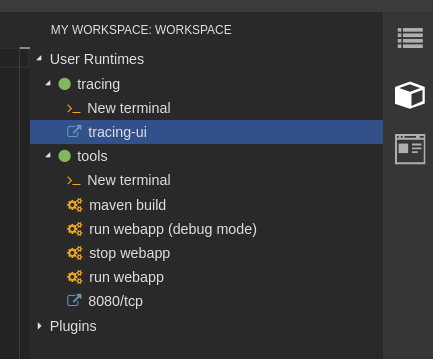
As explained on the Eclipse Che website, “Che brings your Kubernetes application into your development environment and provides an in-browser IDE, allowing you to code, build, test and run applications exactly as they run on production from any machine”. However when deployed in your production environment, those same applications can be monitored using observability tools to understand their performance to help inform future improvements.

Takeaways from PagerDuty Summit: Tracing + Timely Alerts

Last week, we spoke with a lot of folks at PagerDuty Summit, where we explored the power of error monitoring in a world that’s always on (or on-call). What a neat tweet. Throughout our conversations, one thing became clear: developers are seeking out increased efficiency — they want to minimize time to error detection and resolution. They want to know about issues, find the root cause, and fix them quickly so that they can move on to other things — like writing more code.

Weaveworks Combines Jaeger Tracing With Logs and Metrics for a Troubleshooting Swiss Army Knife

Founded in 2014, Weaveworks Inc. makes software that helps developers and DevOps teams build, run and manage containerized applications on Kubernetes. Its products include GitOps-based cluster management, and application delivery, observability and monitoring solutions for services running on Kubernetes. It is a founding member of the Cloud Native Computing Foundation.

Distributed Tracing with Sentry: How to Find the Root Cause of Errors Across Applications

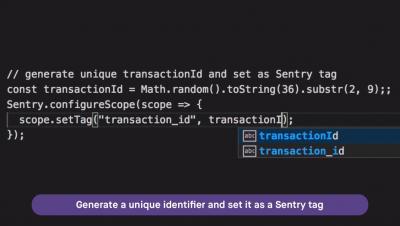
Implementing Sentry on all your services allows you to use distributed tracing to find the root cause of errors. Just because an error happens in a browser or mobile app, doesn’t mean the issue is with the frontend or mobile code. The issue could stem from an error with code in a different project that they interact with in some way. Distributed tracing empowers developers to find the actual cause of hard to fix issues.

How Grafana Labs Is Running Jaeger at Scale with Prometheus and Envoy

At Grafana Labs, we are always working on optimizing query time on our Grafana Cloud hosted metrics platform, which incorporates our Metrictank Graphite-compatible metrics service, and Cortex, the open source project for multitenant, horizontally scalable Prometheus-as-a-Service.