Dashboard Fridays: Sample Kubernetes dashboard
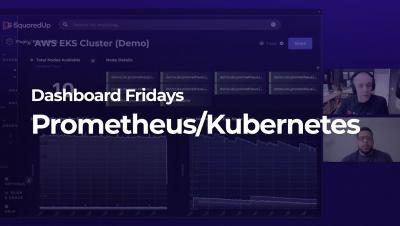
Engineers need to understand the status of microservices run on EKS, like health status of clusters and nodes, to avoid issues impacting business critical microservices. Plus, you need to be able to keep an eye on EKS resources, including whether the Kubernetes cluster has auto-scaled (where enabled). Usually, to view these metrics, it requires looking at each EKS cluster and node group individually in the AWS Console, or via another complex third-party dashboarding tool. The data is siloed and difficult to consolidate.