Operations | Monitoring | ITSM | DevOps | Cloud

SCOM

The latest News and Information on Service Center Operations Manager and related technologies.

Dashboard Fridays: Sample Google Compute Engine Dashboard

This Google Compute Engine dashboard shows key metrics about any GCE instances, managed instance groups, and related resources such as GCE disks. These metrics include utilization of resources and health status. Tune in to learn how it was made, the challenges it solves, and our top tips for building it yourself.

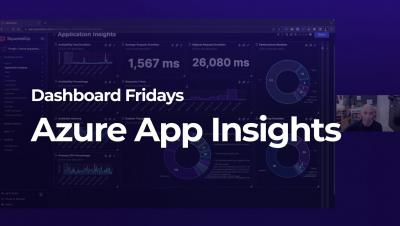
Dashboard Fridays: Sample Azure Application Insights Dashboard

This SquaredUp dashboard uses the Azure plugin to surface key performance metrics from Application Insights. Common user experience metrics are all provided out of the box, and we can query, summarize, and analyse the raw logs and traces. Tune in to learn how it was made, the challenges it solves, and our top tips for building it yourself.

Dashboard Fridays: Sample AppDynamics Dashboard

Together, these three AppDynamics dashboards provide a high-level overview of the health and performance of a service – reporting on application-level metrics, infrastructure, and more importantly, end-user experience. Tune in to learn how it was made, the challenges it solves, and our top tips for building it yourself.

Citrix HDX Teams Redirection Service is not running

The Citrix HDX Teams Redirection Service is part of the Citrix Virtual Desktop Agent software since version 1906. The service runs on a VDA machine (single- or multi-session) and provides redirection services which offload audio, video and screensharing in Microsoft Teams for optimizing the user experience for Microsoft Teams when used within the VDA.

Jira Automation Demystified

Repetitive tasks can be time consuming. In an ideal world, automation would remove all of the grunt work when it comes to solving business problems, freeing us up to execute on more strategic decisions. Luckily, Jira has the capabilities to take a load of tasks off your hands – including tracking your issues, posts, features, and more. This blog will walk you through the options available and offer top tips on how to set this up.

Dashboard Fridays: Zendesk

This Zendesk dashboard built in SquaredUp provides an overview of the support tickets that have been raised in Zendesk, information on tickets created, against which form, what status they are in, and how many when taken by users. Tune in to learn how it was made, the challenges it solves, and our top tips for building it yourself.

Dashboard Fridays: Azure DevOps

This SquaredUp dashboard uses the Azure DevOps plugin to let you monitor the status of your CI/CD automation, monitor Azure DevOps for failures and large queues, track the usage of your agents and resources, and summarise work items and test cases. Tune in to learn how it was made, the challenges it solves, and our top tips for building it yourself.

NiCE VMware Management Pack 5.6 for Microsoft SCOM

Unlock business benefits by monitoring your VMware’s High Availability infrastructure. More performance, more availability, and more transparency. Get the most important advantages that extended VMware monitoring can offer with the new NiCE VMware Management Pack for Microsoft SCOM. Secure, protect, and manage large VMware environments and digital workspaces based on advanced analytics.