Operations | Monitoring | ITSM | DevOps | Cloud
JavaScript
New Browser APIs for Detecting Javascript Performance Issues in The Production
Users nowadays demand the greatest possible experience, which implies top-notch performance. Smooth scrolling, prompt interaction responses, a fast page load time, and flawless animations are all things they anticipate. Local profiling to identify performance issues is convenient, but it only provides a limited amount of information. While things may run smoothly on our high-end developer machines, the user may be dealing with poor hardware and a bad experience.
A Quick Introduction to TrackJS
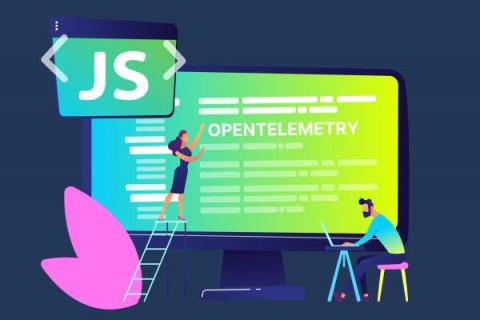
Auto-Instrumenting NestJS Apps with OpenTelemetry
In this tutorial, we will go through a working example of a NestJS application auto-instrumented with OpenTelemetry. In our example we will use a simple application that outputs “Hello World!” when we call it in the browser. We will instrument this application with OpenTelemetry’s Node.js client library to generate trace data and send it to an OpenTelemetry Collector. The Collector will then export the trace data to an external distributed tracing analytics tool of our choice.
Instrumenting your webpack-bundled JS code
OpenTelemetry (OTel) is an emerging industry standard that dev teams use to instrument, generate, collect, and export telemetry to better understand software performance and behavior. At Helios, we leverage OTel to provide developers with actionable insights into their code within distributed systems. We give them visibility into how data flows through their applications, enabling them to quickly identify, reproduce and debug issues in their flows.
Implementing OpenTelemetry in Angular application
Debug JavaScript in Mobile Safari (iOS) in 8 easy steps
How OpenTelemetry Works Under the Hood in JavaScript
OpenTelemetry (OTel) is an open source selection of tools, SDKs and APIs, that allows developers to collect and export traces, metrics and logs. It’s the second-most active project in the CNCF, and is emerging as the industry standard for system observability and distributed tracing across cloud-native and distributed architectures. OTel supports multiple languages, like JavaScript, Java, Python, Go, Ruby and C++.
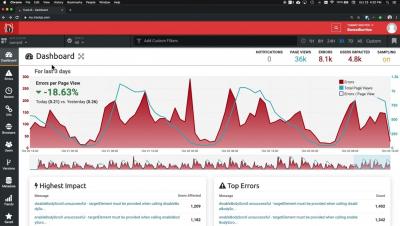
DevOps.JS Workshop: Tracking errors and slowdowns across JS applications using Sentry
Kubernetes Easy Button - Running Your JS Apps on Kubernetes with Shipa
Kubernetes is becoming a dominant platform for running workloads. As the Kubernetes ecosystem continues to advance capturing a wider swath of workloads, eventually your code might be headed to Kubernetes. As a Tech Lead at Shipa responsible for front-end engineering e.g what you see on the screen, my job crosses JavaScript Frameworks and Kubernetes on a daily basis.


