Operations | Monitoring | ITSM | DevOps | Cloud

Introducing PagerDuty Status Pages for Improved Customer Communication and Savings

In 2023, the fight to retain customers will be one of the biggest factors determining whether a business can survive the recession all are predicting. One of the key findings from the 2022 State of Service Report from Salesforce is that great service is at the heart of customer retention: 48% of customers will switch brands for better customer service when something goes wrong, and they view open communication as a key factor in how a customer might gauge the quality of customer service.

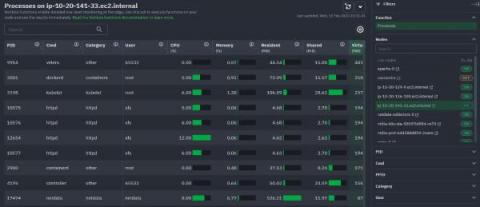
4 New AWS Monitoring Dashboards for EC2, EBS, RDS and S3

This is just a quick blog to draw attention to some new and enhanced monitoring dashboards we have added to eG Enterprise in the upcoming release (v 7.2) to provide quick and powerful overviews of a range of AWS services. As with all our dashboards, color-coded overlays provide guided drilldown for help desk operators and administrators. If a component has an issue, an amber or red indicator is overlaid to allow the viewer to click through to further diagnostic information.

Elastic Observability 8.6: Maximizing operational efficiencies with improved application analysis and workflow integrations

Elastic Observability 8.6 introduces a set of capabilities improving production operations through the introduction of host (EC2/GCP compute/Azure compute) observability, application dependency operations views (insights into databases, caches, etc), and a new connector for Opsgenie. These new features allow customers to: Elastic Observability 8.6 is available now on Elastic Cloud — the only hosted Elasticsearch offering to include all of the new features in this latest release.

Elastic Enterprise Search 8.6: Reduce time to relevant search results - for file systems, MongoDB, and Amazon S3

Elastic Enterprise Search 8.6 enables customers to index searchable content on file systems, network drives, MongoDB, and Amazon S3. With new connectors for network drives and Amazon S3, content indexed can easily be transformed for natural language processing (NLP) use cases with intuitive tooling to test and tune your search experience with the trained model of your choice.

Introducing easy custom event monitoring for serverless applications.

Today we are excited to announce scheduled searches – a new feature on Dashbird that allows you to track any log event across your stack, turn it into time-series metric and also configure alert notifications based on it. This has been one of the most requested features across our users and we are thrilled to make it available for all users starting today.

Longhorn 1.4 - Starting A New Year With A New Release

The team are excited to start the new year with the latest release for Longhorn 1.4. This latest version is packed with new features and enhancements designed to help make cloud native enterprise storage simpler and more accessible to the cloud native community. For existing users of Longhorn, this latest release is focused on helping you build better value and resiliency across your storage strategy.

Announcing HAProxy Data Plane API 2.7

HAProxy Technologies is proud to unveil the 2.7 release of HAProxy Data Plane API. This release was a huge undertaking, and as with the 2.6 release, we focused on extending support for configuration keywords. We are happy to announce that with this release we support all HAProxy configuration keywords in the Data Plane API. Along with enhanced keyword coverage, we’ve added the ability to specify multiple named defaults sections through the API.

Cron Job Monitoring Beta - Because scheduled jobs fail too

Do your cron jobs (aka scheduled jobs) ever fail or not run as expected? Scheduled jobs are supposed to be predictable – as the name implies. But as with many things, predictable!= reliable. Cron jobs fail too and we think you should know when that happens, Crons allows you to monitor the uptime and performance of any scheduled, recurring job in Sentry. Once set up, you’ll get alerts and metrics to help you solve errors, detect timeouts, and prevent disruptions to your service.

CFEngine 3.21 LTS released - Unification

Today, we are pleased to announce the release of CFEngine 3.21.0! The focus of this new version has been unification. Across our websites and UI, you should see that it’s a much more modern and unified experience, whether you’re reading this blog post on cfengine.com, browsing the new documentation site, looking for modules on the CFEngine Build website, or adding input to modules within Build in Mission Portal.

Grafana Agent v0.30: Flow adds support for logging pipelines and graduates to beta

Grafana Agent v0.30 is here! The past couple of Grafana Agent releases have been pretty exciting for us. We introduced Agent Flow as a new way to configure, run, and debug telemetry pipelines. We also announced OpenTelemetry Collector components to expand on our Big Tent philosophy and allow users to switch seamlessly between the Prometheus and OTel ecosystems. This latest release continues that momentum by introducing Loki components for building logging pipelines and marking Flow mode as beta!