Operations | Monitoring | ITSM | DevOps | Cloud

Grafana Loki 2.7 release: TSDB index, Promtail enhancements, and more

Grafana Loki 2.7 has arrived! With it comes an experimental feature we are rather excited about: a redesigned index based off of the Prometheus TSDB index. While we are still in the early stages, this enhancement in Grafana Loki, which we previewed at ObservabilityCON 2022, creates a smaller storage footprint, better query performance, and much more that we will dive into below!

Your guide to Kubernetes Dashboards

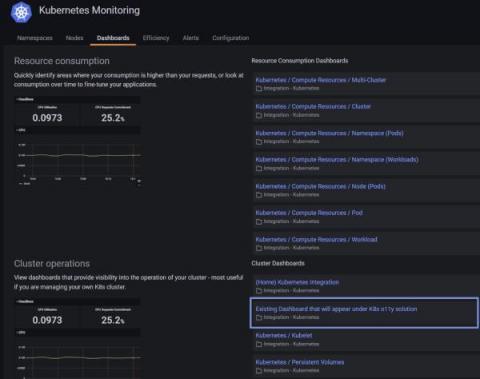
As a developer, it can become challenging to manage Kubernetes and develop applications simultaneously. That’s why we put together this guide to show you how the Kubernetes Dashboard can help developers overcome this problem and get an overview of the cluster and its workloads. From this, developers can focus more on application development while stressing less on cluster management.

TraceQL: a first-of-its-kind query language to accelerate trace analysis in Tempo 2.0

The much-anticipated release of Grafana Tempo 2.0, which we previewed at ObservabilityCON 2022, will represent a huge step forward for the distributed tracing backend. Among the biggest highlights will be TraceQL, a first-of-its-kind query language that makes it easier than ever to find the exact trace you’re looking for. There’s supposed to be a video here, but for some reason there isn’t. Either we entered the id wrong (oops!), or Vimeo is down.

Visualize everything with Uptrends Grafana integration

Grafana is long known as a leading open source platform for those needing beautifully rich, composable operational dashboards. The notion of being able to connect disparate data sources to Grafana for improved monitoring of infrastructure, log analytics, and overall better operational efficiency is an increasingly alluring prospect for those in fintech, ecommerce, and other industrial sectors.

Grafana 9.3 release: Enhanced navigation, Grafana localization, Grafana Alerting updates, and more!

Welcome to Grafana 9.3! Get Grafana 9.3 In our continued efforts to make Grafana more accessible and easier to use, we are excited to showcase new updates to improve navigation, introduce localization, and much more. Read our What’s New documentation to learn all about the latest release and for more details, refer to the changelog.

How Banco Itaú tracks 1.5B daily metrics on-prem and in AWS with Grafana and observability

Brazil’s Banco Itaú is the largest bank in Latin America, so when performance and uptime issues impact its applications, the reverberations can be massive. “It can impact the whole economy of Brazil. It can damage other banks’ business too,” Ana Paula Genari Martin, SRE manager at Banco Itaú, said in her recent ObservabilityCON talk. And keeping those applications running is no small feat, considering the size of their digital operations.

Building AppStack Dashboards

AppStack™ helps you diagnose and troubleshoot performance problems faster—from applications to servers, virtualized infrastructure, databases, and storage systems. The AppStack dashboard shows you all performance information across the application stack with relationships between various elements of your environment. Kevin M. Sparenberg, SolarWinds THWACK Community Evangelist, shows you how the dashboard works and why it’s so important for troubleshooting application issues in your IT infrastructure.

Grafana crosses 1 million mark for active instances

It’s hard to think of a use case that Grafana hasn’t been used for. When Torkel Ödegaard launched the Grafana open source project with his first commit in December 2013, “my goal was to make time series data accessible for a wider audience, to make it easier to build dashboards, and to make graphs and dashboards more interactive,” he said.

Grafana Cloud Access Policies: Say hi to the new Cloud API keys

Until recently, Grafana Cloud users had to rely on API keys to read and write data to and from the composable observability platform. These API keys had minimal features, which limited administrators’ ability to manage account access on a granular level. We’re keenly aware of these shortcomings, and we’ve been working to overhaul and replace these API keys with something more flexible, more reliable, and more secure.