Operations | Monitoring | ITSM | DevOps | Cloud

Have fun again creating! Get to know visual console and dashboard editing

Did you know that the visual console editor allows users to design the final look by dragging elements with the mouse? You just have to choose the background and icons that represent the status of each relevant aspect you want to display. We tell you this and much more in the video on our workshop.

How Grafana unites Medallia's observability stack for faster, better insights

California-based Medallia captures feedback signals — in-person interactions, customer surveys, call centers, social media, etc. — to help businesses improve their customer experience. In much the same way, the company’s Performance and Observability Engineering team captures observability signals to optimize the experience for internal users.

How to centralize thousands of data sources with Grafana: Inside Adform's observability system

Over the course of two decades, Adform grew from a dream between friends huddled in a basement to a leading advertising tech platform powering more than 25,000 clients worldwide. Success brought external accolades, but it also created the need for internal innovation to support the company’s continued growth. In 2018, Adform was still operating in startup mode, which meant developers and teams cherry-picked the tools that worked best for them.

Dashboard Design: Visualization Choices and Configurations

There are many visualization types and configurations available to choose from. In general, keep your visualizations as simple and straightforward as possible to avoid distraction and highlight only the most important information. If there is too much unnecessary information on the page it can be overwhelming and focus can be misdirected to unimportant details.

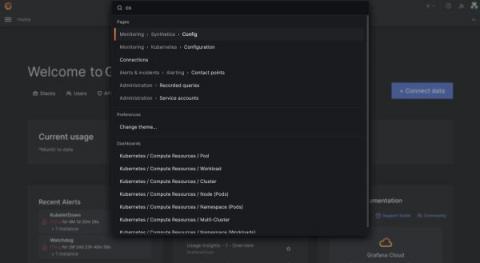
Grafana 9.2: Create, edit queries easier with the new Grafana Loki query variable editor

As part of the Grafana 9.2 release, we’re making it easier to create dynamic and interactive dashboards with a new and improved Grafana Loki query variable editor. Templating is a great option if you don’t want to deal with hard-coding certain elements in your queries, like the names of specific servers or applications. Previously, you had to remember and enter specific syntax in order to run queries on label names or values.

Grafana vs. Tableau

When it comes to visualization tools, there are various options, all designed for different kinds of data. Some of the most recognized among them include Grafana and Tableau. If you’re not sure which one to use, this article should give you a better idea of what kind of purpose each one has and which one will suit your needs best. One great way to find out what tool works best for you is to try it out! Try out Grafana in seconds on MetricFire's Hosted Grafana free trial.

How many data sources do you monitor? Find out how you measure up in our Observability Survey

Here at Grafana Labs, we’re deeply committed to our “big tent” philosophy — the idea that disparate data sources, from different software providers, in different industries, built for completely different use cases, can come together in one composable observability platform. As part of that commitment, we’ve set out to hear from our community about their observability practice and what they hope to see in this space in the future.

Grafana Agent 0.29.0 release: New OpenTelemetry components

Today the Grafana Agent team is excited to announce the release of Grafana Agent v0.29.0. This September, we introduced a new way to easily run and configure Grafana Agent called Grafana Agent Flow, our new dynamic configuration runtime built on components. Within Flow, we are also embracing Grafana Labs’ big tent philosophy by introducing OpenTelemetry (OTel) Collector components and converters for traces, metrics, and logs in Agent v0.29.0.