Operations | Monitoring | ITSM | DevOps | Cloud




Enterprise IT Dashboards
Interpreting data and making fast decisions is critical for any leader in today's business world. But how is it done? Everyone remembers the old way of doing things where analysts would manually crunch the numbers and give a final output. This business intelligence would be presented to their boss, and decisions would be made. This batch way of running numbers and presenting them is not sustainable due to the massive amount of manual effort involved to recompile datasets and present them properly.

Query and analyze Amazon S3 data with the new Amazon Athena plugin for Grafana
In collaboration with the AWS team, we have recently released the new Athena data source plugin for Grafana. Athena is an interactive serverless service that makes it easy to analyze data in Amazon S3 using standard SQL. Athena supports a wide variety of data formats including CSV, JSON, ORC, Arvo, and Parquet. Athena also integrates with AWS Glue Data Catalog, which allows you to create tables and query data based on a central metadata store of many AWS services, such as CloudFront, ELB, and more.
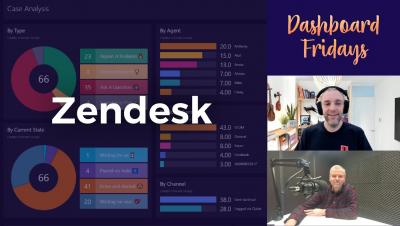
Dashboard Fridays: Sample Zendesk Support Dashboard

Unifying VM and microservice monitoring with Kubernetes, Prometheus, and Grafana
According to a 2020 CNCF survey, the use of containers in production has been rapidly increasing for the past several years. Nutanix, a global leader in cloud software and a pioneer in hyperconverged infrastructure solutions, is part of that trend.
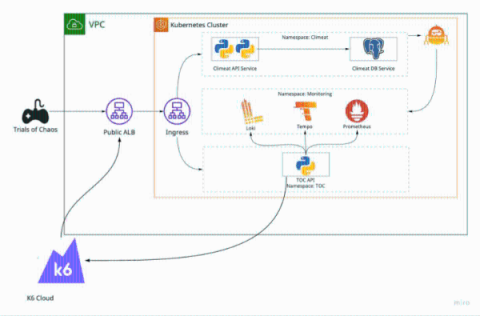
Testing shift left observability with the Grafana Stack, OpenTelemetry, and k6
Development is no longer a linear journey from point A to point B. As more projects shift into a state of organic growth, user feedback and constant experimentation are increasingly becoming the norm, if not the standard for engineering. “In order to support this rapid experimentation, we’re beginning to embrace new working methods and practices,” said Vinodh Ravi, Executive Director of Platform Engineering at JPMorgan Chase.
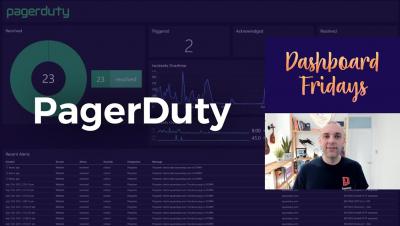
Dashboard Fridays: Sample PagerDuty Alerting dashboard

New in the Kubernetes integration for Grafana Cloud: curated dashboards, built-in alerts, and more
Back in May, we announced the Kubernetes integration to help users easily monitor and alert on core Kubernetes cluster metrics using the Grafana Agent, our lightweight observability data collector optimized for sending metric, log, and trace data to Grafana Cloud. The integration allows Grafana Cloud users to monitor and alert on Kubernetes cluster metrics. Since the original release, we’ve added new features and enhancements to help our users go even further.

Grafana 8.3 released: Recorded queries, panel suggestions, new panels, added security, and more
Grafana 8.3 is here! This is an exciting release for Grafana Labs. This release includes the new Candlestick panel, a new visualization suggestions engine, support for AWS Metrics Insights and, for our Grafana Enterprise users, recorded queries. Get 8.3 You can get started with Grafana in minutes with Grafana Cloud. Here’s a closer look at the important new features in 8.3.

Dashboard Studio on the Go
We heard that you love telling complex data stories by building beautiful dashboards on Splunk Dashboard Studio. Now get these dashboards into the hands of even more users anywhere at any time with Dashboard Studio on Splunk Mobile and Splunk TV.