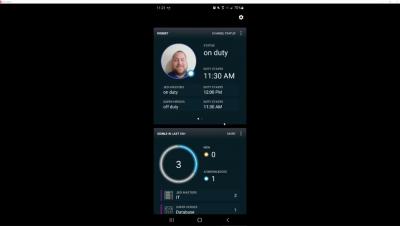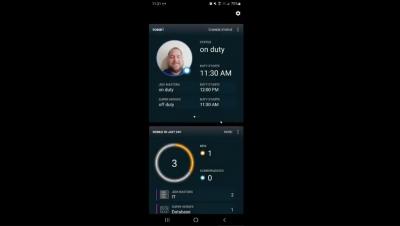
The SIGNL4 mobile App
Brief overview of the functions of the SIGNL4 mobile App


Being in touch with your customers is key to any business. We at Derdack pride ourselves in being customer first when it comes to not only product enhancements and features but also support and building that customer/vendor relationship that lasts for years. We recently took a trip to Texas to visit several customers and the feedback was invaluable! We received a lot more information with a face-to-face meeting that just would not be the same if it were done virtually, like over Teams.
Today, IT operations teams have to process large volumes of events or alarms in near real-time in order to protect service levels, stay competitive, and deliver a great experience to customers. If it takes too long for teams to spot and repair issues, an organization runs the risk of significant business service downtime, SLA penalties, and brand reputation damages. As IT landscapes continue to grow in scale and complexity, guarding against these risks becomes increasingly difficult.
We are pleased to announce that we’ve recently launched new and improved alerting features which have been rolled out to users across all of Logit.io’s operating regions. As part of these improvements, we have sought to improve platform usability and have now included a new menu from which users can readily configure a number of popular alert types straight from our pre-configured templates.
We often hear from Grafana Cloud users who are asking for guidelines on how to write better alerts on synthetic monitoring metrics and get notified when synthetic monitoring detects a problem. We already ship a predefined alert in Grafana Cloud synthetic monitoring. A predefined alert that we ship is alerting on the probe_all_success_sum metric and makes use of the alert sensitivity config to create multiple Grafana Cloud alerting rules. Check out synthetic monitoring alerting docs for details.