Operations | Monitoring | ITSM | DevOps | Cloud

Blog

How to Keep Your System Visible in the Age of Remote Working

Monitoring IT infrastructure and services has always been an essential IT prerequisite. However, your IT monitoring system and security measures need to upgrade with an exponential increase in the number of remote users post-pandemic. For instance, consider this: At the end of a work day, you are notified that one of your critical services has gone down. But the problem is that five teams support different processes of that service.

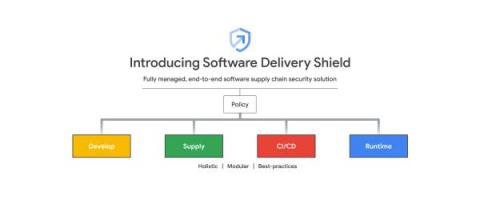
Introducing Software Delivery Shield for end-to-end software supply chain security

Organizations and their software delivery pipelines are continually exposed to growing cyberattack vectors. Coupled with the massive adoption of open source software, which now helps power nearly all of our public infrastructure and is highly prevalent in most proprietary software, businesses around the world are more vulnerable than ever. Today’s organizations need to be more vigilant in protecting their software development infrastructure and processes.

How to change the Tiering of Azure Blobs

In this blog post, I will show you how easy it is to move a single Azure Blob or even select mutlipe or the complete container and move those blobs from any storage tiering to another with just a few clicks. There are cost benefits moving your Azure Blobs down to a lower Storage Tier, Hot being the most expensive, with a cool a little bit cheaper, and the Archive Blob Tier having the lowest cost option. For most Azure Storage Cost saving ideas, we cover some in another blog.

How AIOps enhances operational efficiency

Digital data is everywhere, and its sheer volume and ambiguity often make it challenging for us humans to analyze. That’s why we use a special branch of AI called artificial intelligence for IT operations (AIOps) to reveal the deeper structure of copious data. AIOps sits at the intersection of big data and machine learning to improve the efficiency of IT operations.

Setting better SLOs using Google's Golden Signals

To many engineers, the idea that you can accurately and comprehensively track your application's user experience using just a few simple metrics might sound far-fetched. Believe it or not, there are four metrics that aim to do just that. They're called the four Golden Signals and should be a core part of your observability and reliability practices.

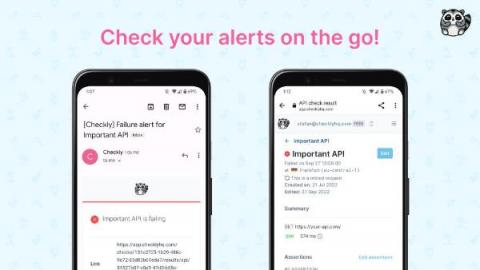
Checkly Alerting Improvements and Our New Slack Community

Welcome to day one of our very first Launch Week! In the upcoming days, we’ll release new features every day. We’ll share new alerting capabilities, unlock the power of Playwright, and will talk about new ways to control and write your Browser checks. It’ll be a nice feature and improvements mix, trust me! To kick things off, let’s have a look at what’s new in the world of monitoring and alerting.

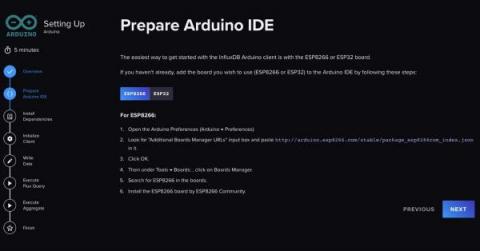
Product Update - Arduino Onboarding Made Easy

We love to write and ship code to help developers bring their ideas and projects to life. That’s why we’re constantly working on improving our product to meet developers where they are, to ensure their happiness, and accelerate Time to Awesome. This week, we are covering a product release that we think will save you time and effort when onboarding to time series and InfluxDB using Arduino.

What's New in Checkly Launch Week

The Checkly development team is continually improving our platform and user experience, and we’re excited to unveil some new features that we’ve been working on during our first ever Checkly Launch Week. From October 11th through 14th, we’ll be announcing and discussing our latest innovations, new features, functionality, and capabilities for users every single day of the week.

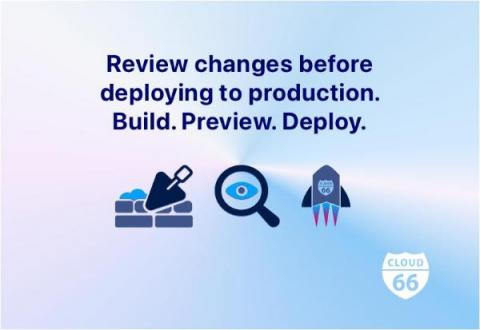
Review changes before deploying to production - Build. Preview. Deploy.

Whether you have two or two dozen developers working on features for your product, updates can introduce bugs or unwanted changes. Therefore, before merging a feature branch to production, you can review all the changes with our preview deployment feature. It allows you and your team to quickly and easily check that the latest changes work as desired. It also allows you to share feedback and helps prevent “it worked on my machine” scenarios.

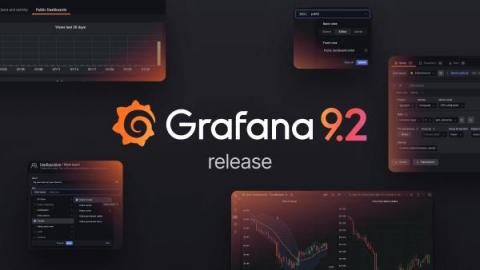
Grafana 9.2 release: New Grafana panel help options, Grafana oauth updates, simplified variable editor for Grafana Loki, and more!

Welcome to Grafana 9.2, a jam-packed minor release with a wide range of improvements to help you create and share Grafana dashboards and alerts. Along with new developments for public dashboards and support for Google Analytics 4 properties, Grafana 9.2 offers new ways to connect with support teams about panel issues, a simplified query variable editor for Grafana Loki, improvements to access control, and much more.