Operations | Monitoring | ITSM | DevOps | Cloud
Blog
Mobile Proxies Explained: How They Enhance Your Mobile Internet Experience?
Optimize Core Web Vitals for SaaS and Custom Apps
A set of metrics known as Core Web Vitals have become key indicators of website performance and user satisfaction. Monitoring and optimizing these metrics for web pages can be challenging. Today, we learn how to use synthetic and real-user monitoring to measure, analyze, and improve Core Web Vitals. Delivering a smooth user experience plays a pivotal role in determining website application success.
Unlocking Vitality: The Essence of a Balanced Diet and Crafting Your Healthy Eating Plan
How Large Language Models Really Work
Grafana Beyla 1.0 release: zero-code instrumentation for application telemetry using eBPF
Just two months after introducing the public preview of Grafana Beyla, we are excited to announce the general availability of the open source project with the release of Grafana Beyla 1.0 at ObservabilityCON 2023 today. We’ve worked hard in the last two months to stabilize, stress test, and refine the features that were part of the public preview of this open source eBPF auto-instrumentation tool.
How Asserts.ai will make it even easier for Grafana Cloud users to understand their observability data
At Grafana Labs, our mission has always been to help our users and customers understand the behavior of their applications and services. Over the past two years, the biggest needs we’ve heard from our customers have been to make it easier to understand their observability data, to extend observability into the application layer, and to get deeper, contextualized analytics.
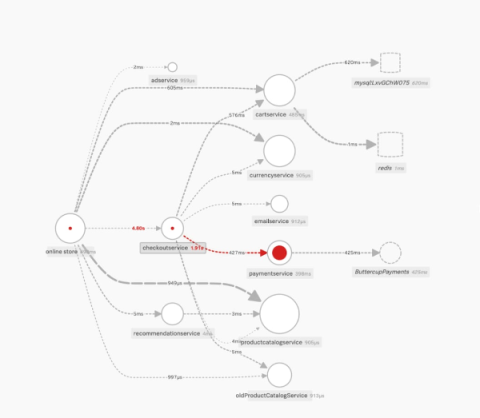
5 Best Frontend Error Monitoring Tools
You have so many options for frontend error monitoring today, and they all do slightly different things. We looked at everyone and did a breakdown of the most important features for frontend, the problems developers run into, end user reviews, and pricing structures to see how the best vendors stack up.


